Published October 2, 2026
Do Home Prices Fall When Rates Spike? Seattle Says Rarely

Mortgage rates have jumped from about 6% in February to 7.28% this week. Whenever that happens, we hear the same question from buyers: "If rates are up, won't prices drop? Shouldn't I wait and buy cheaper?"
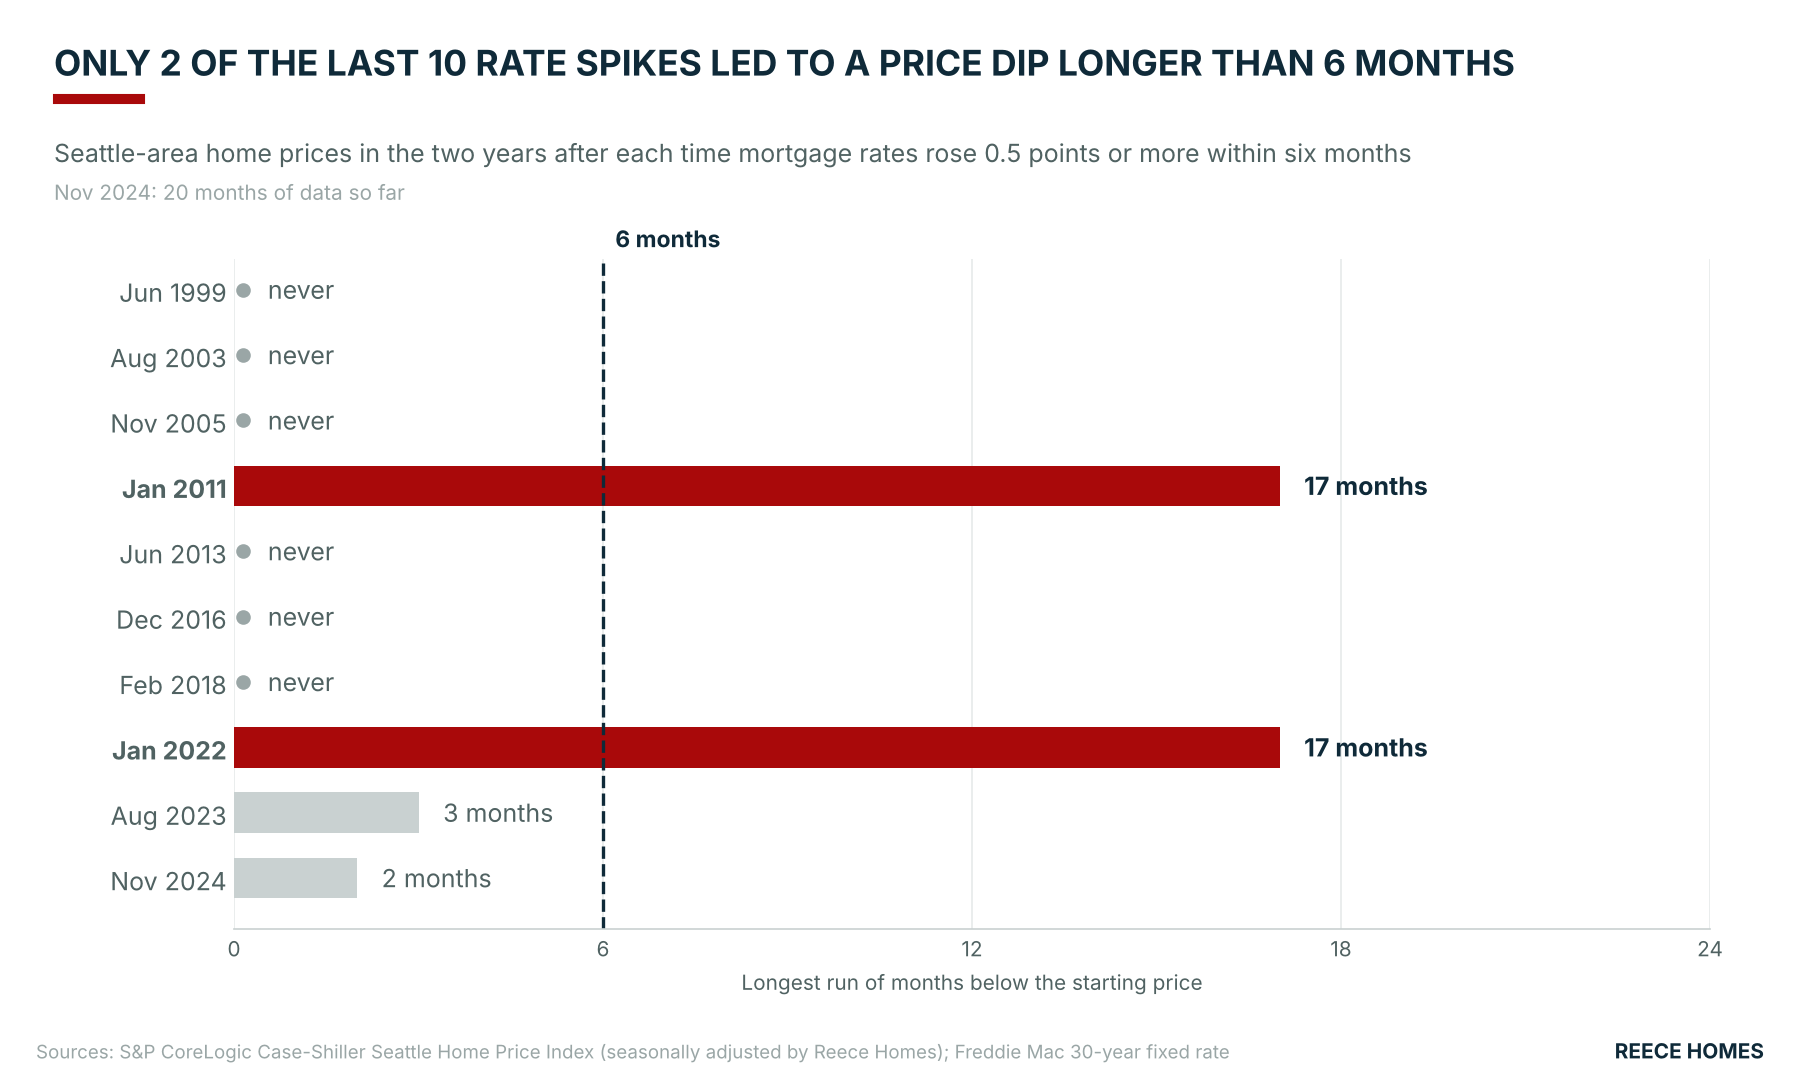
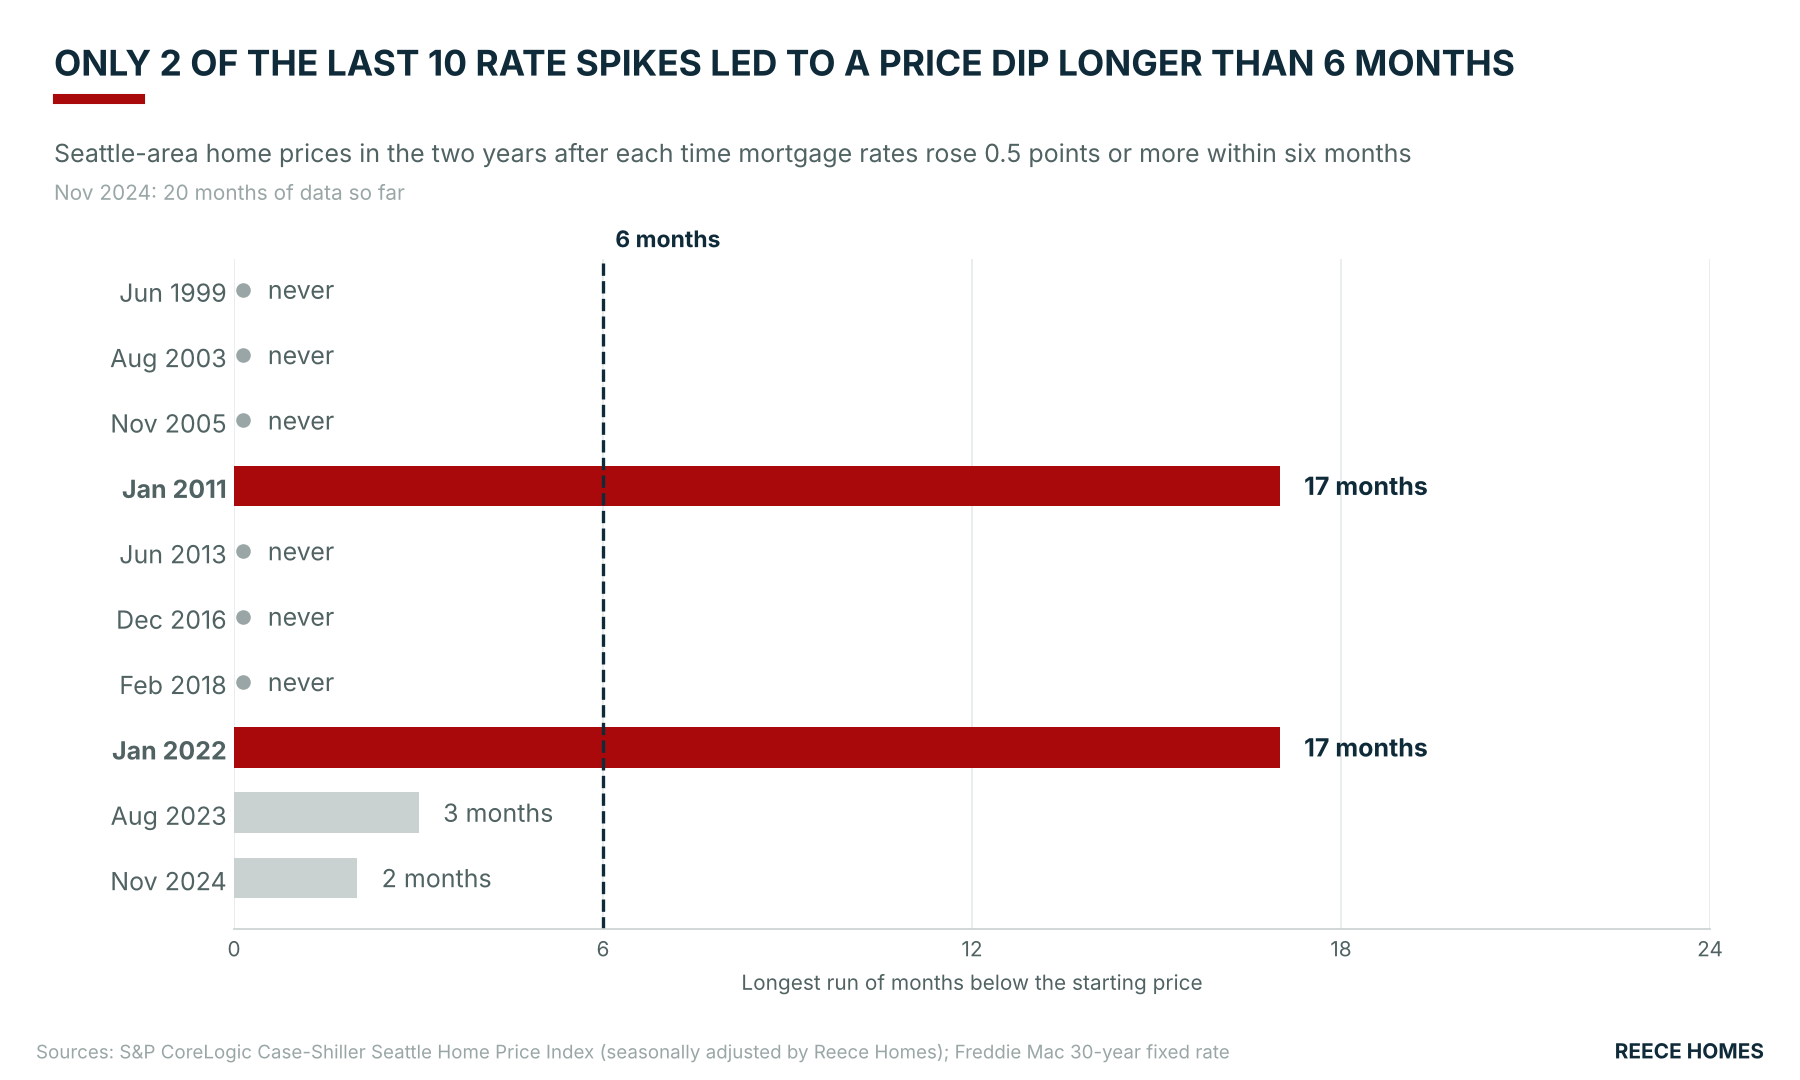
We went back through more than 25 years of Seattle-area price data to find out. In the last 10 times mortgage rates spiked by half a point or more, home prices fell below their starting level for more than six months only twice. In the other eight, prices either kept rising or dipped briefly and recovered within a few months. And only one of those two declines was actually driven by rates.
The record: 10 rate spikes since 1999
In eight of the last ten spikes, prices never spent more than a few months below where they started. Most didn't dip at all.
And two years after the spike, prices were at or above their starting level in all ten cases.
| Rate spike | Rate move | Price change after 1 year | After 2 years |
|---|---|---|---|
| Nov 2024 | 6.18% → 6.80% | −0.1% | +0.4% so far |
| Aug 2023 | 6.26% → 7.07% | +5.2% | +5.1% |
| Jan 2022 | 2.84% → 3.44%, then to 7% | −5.0% | 0.0% |
| Feb 2018 | 3.81% → 4.33% | +2.8% | +9.1% |
| Dec 2016 | 3.44% → 4.20% | +12.7% | +18.4% |
| Jun 2013 | 3.35% → 4.07% | +8.6% | +16.6% |
| Jan 2011 | 4.22% → 4.75% | −4.0% | +4.3% |
| Nov 2005 | 5.58% → 6.33% | +13.0% | +15.0% |
| Aug 2003 | 5.23% → 6.26% | +10.1% | +28.5% |
| Jun 1999 | 6.74% → 7.55% | +8.4% | +13.8% |
The two exceptions, and why they were different
January 2011: the tail end of the housing crash. Seattle prices had been falling since 2007, and they were already down 6.7% from a year earlier when rates ticked up from 4.22% to 4.75%. The rate rise didn't last; rates were back below 4% by the end of 2011. Prices kept sliding for a few more months, as they had been for three years, then bottomed and climbed 4.3% above their January 2011 level within two years. This decline came from the crash, not from rates.
January 2022: the fastest rate surge in 40 years. This was no ordinary spike. Rates went from under 3% to over 7% in about ten months, raising the monthly payment on the same loan by nearly 60%. Prices actually rose another 10% first, peaked in May 2022, then fell 13.9% from that peak. They sat below their January 2022 level for 17 months before recovering to even.
So in the past 25 years, only one rate spike has, on its own, pushed Seattle prices down for more than six months. It took a rate shock more than four times the size of a typical spike to do it.
What this means for buyers today
If you're waiting for higher rates to knock prices down, history says don't count on it. A typical rate spike has been followed by flat-to-rising prices, not a lasting discount.
Today's spike looks like the ordinary kind: about 1.2 points over eight months, not a 4-point shock. And the Seattle market has already been soft for a while. Prices are roughly flat over the past two years, and buyers in King County have 5.1 months of inventory to choose from, the most since 2012.
That gives buyers two things they rarely get at the same time:
- Negotiating room now. More listings, longer market times and sellers willing to deal.
- A path to a lower payment later. If rates fall, you can refinance. If they don't, waiting wouldn't have helped either.
What you can't do is go back and buy at today's price once competition returns. In the 2023 spike, Seattle prices were 5% higher a year later, even though rates stayed above 6.5% for nearly that whole year.
How we measured it
- What counts as a spike: the monthly average 30-year mortgage rate rising 0.5 points or more within six months. We counted from the month the half-point rise was reached, and list the 10 most recent spikes since 1999.
- Prices: the S&P CoreLogic Case-Shiller Seattle Home Price Index, which tracks repeat sales of the same homes across King, Snohomish and Pierce counties. We adjusted it for normal seasonal swings so spring and summer gains don't skew the results.
- "Below for more than six months": prices stayed under their level from the month of the spike for more than six consecutive months within the following two years.
- The November 2024 spike has 20 months of data so far (through July 2026). The current 2026 spike is too recent to include.
Run your own numbers
Every buyer's situation is different. Our Wait for Rates, or Buy Now? calculator shows how buying now and refinancing later compares with waiting, using your price range, down payment and rent. Try the calculator
Want to talk it through? The Reece Homes team can walk you through today's market and connect you with a trusted lender. Contact us
Sources: S&P CoreLogic Case-Shiller Seattle Home Price Index (not seasonally adjusted, via FRED; seasonal adjustment by Reece Homes); Freddie Mac 30-year fixed mortgage rate averages; Northwest Multiple Listing Service® via InfoSparks © 2026 ShowingTime. Past performance doesn't guarantee future results. This is not financial advice.