Published October 15, 2026
When Is the Best Time to Sell a Home in King & Snohomish County? What 20 Years of Data Show

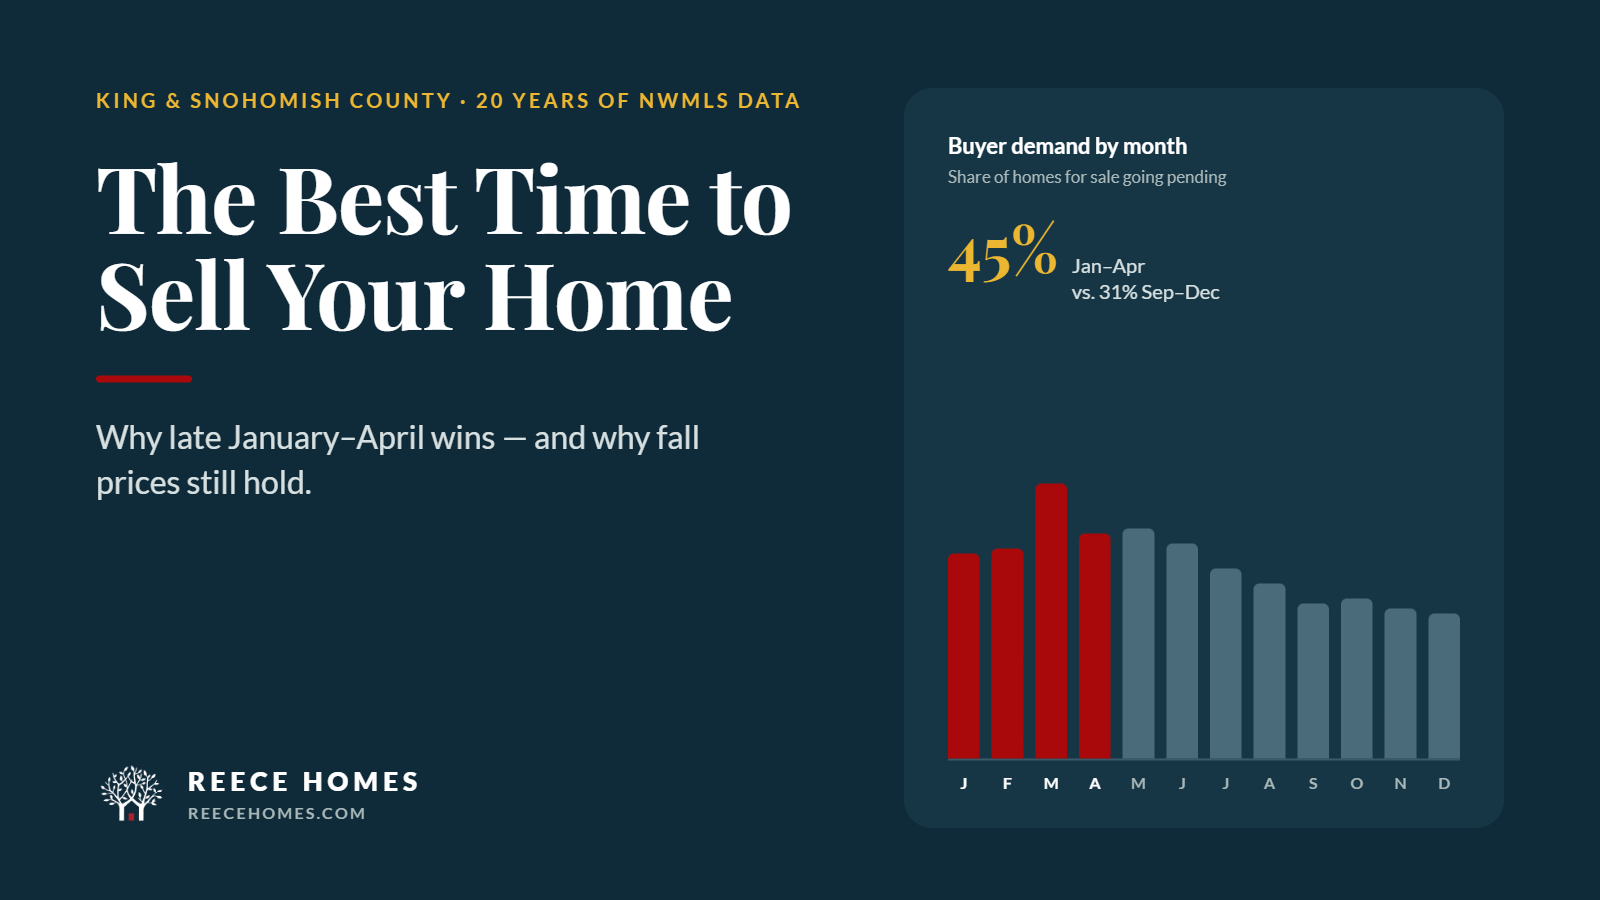
The short answer: in King and Snohomish County, late January through April is the strongest window to list a home. Twenty years of Northwest MLS data (2006–2025) show that this is when buyers are most active, competing listings are scarcest, and sellers keep the highest share of their asking price.
For years, we've told sellers that the best time to sell a house in the Seattle area is early in the year, before the spring rush of listings arrives. It's a pattern we see play out in our own transactions every season. This year we went to the numbers to prove it — every month of NWMLS data for King and Snohomish counties since 2006.
Here's what the data shows, what it doesn't, and why the calendar is only one part of choosing your move date.
At a glance (King + Snohomish, 2006–2025):
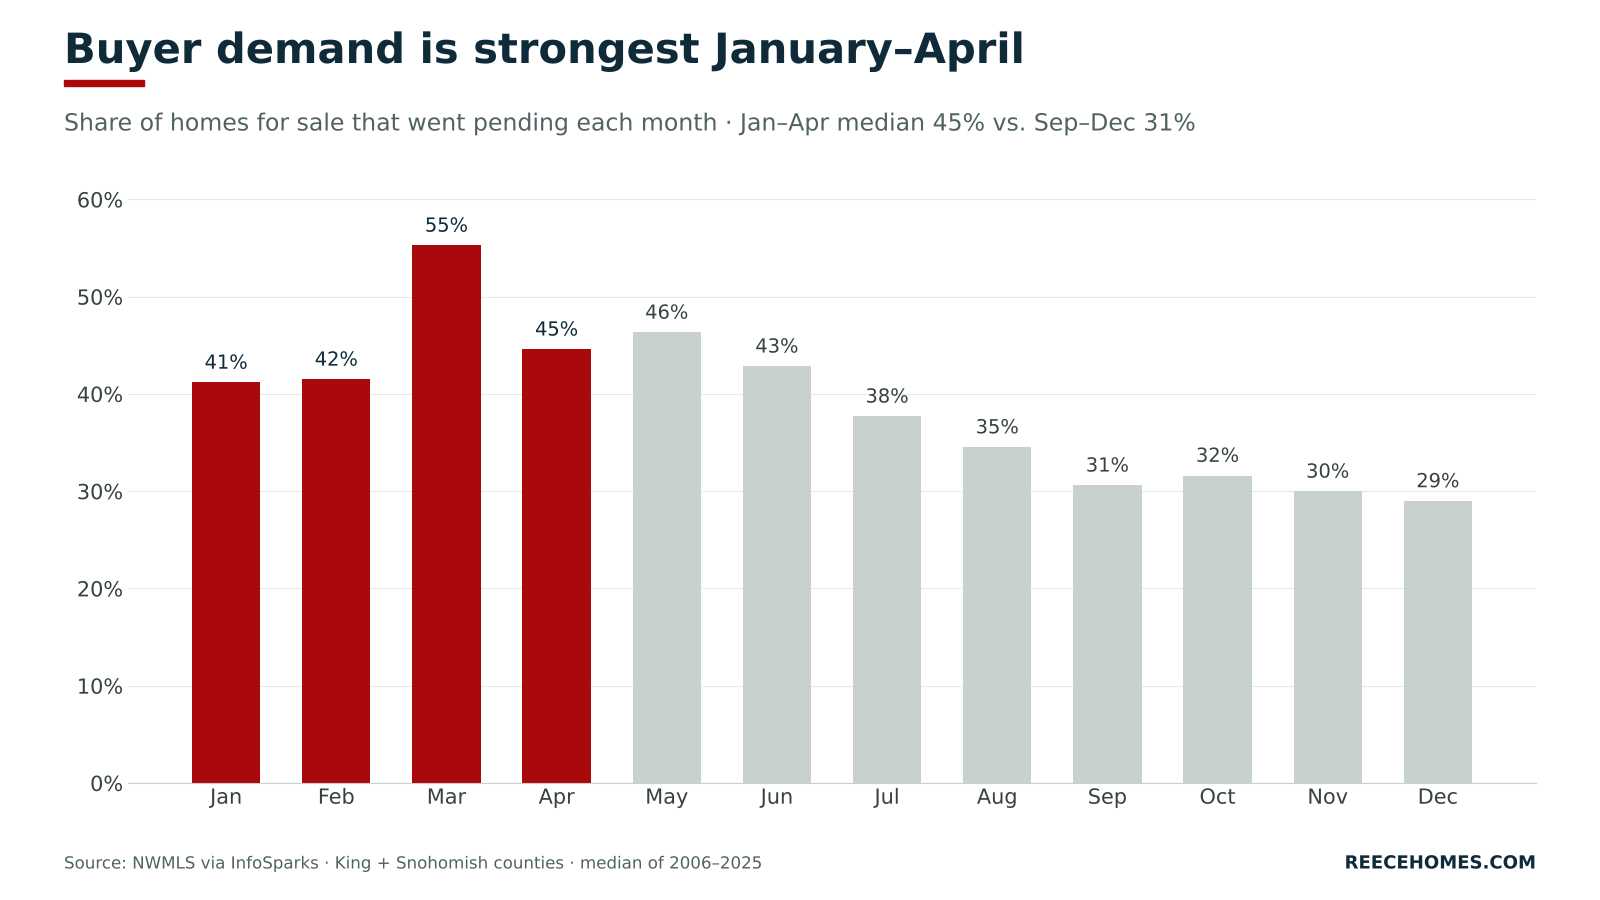
- 45% of homes for sale go pending each month from January to April, versus 31% from September to December.
- Competing inventory sits at about 86% of its yearly average from January to March, then peaks at 118% in September.
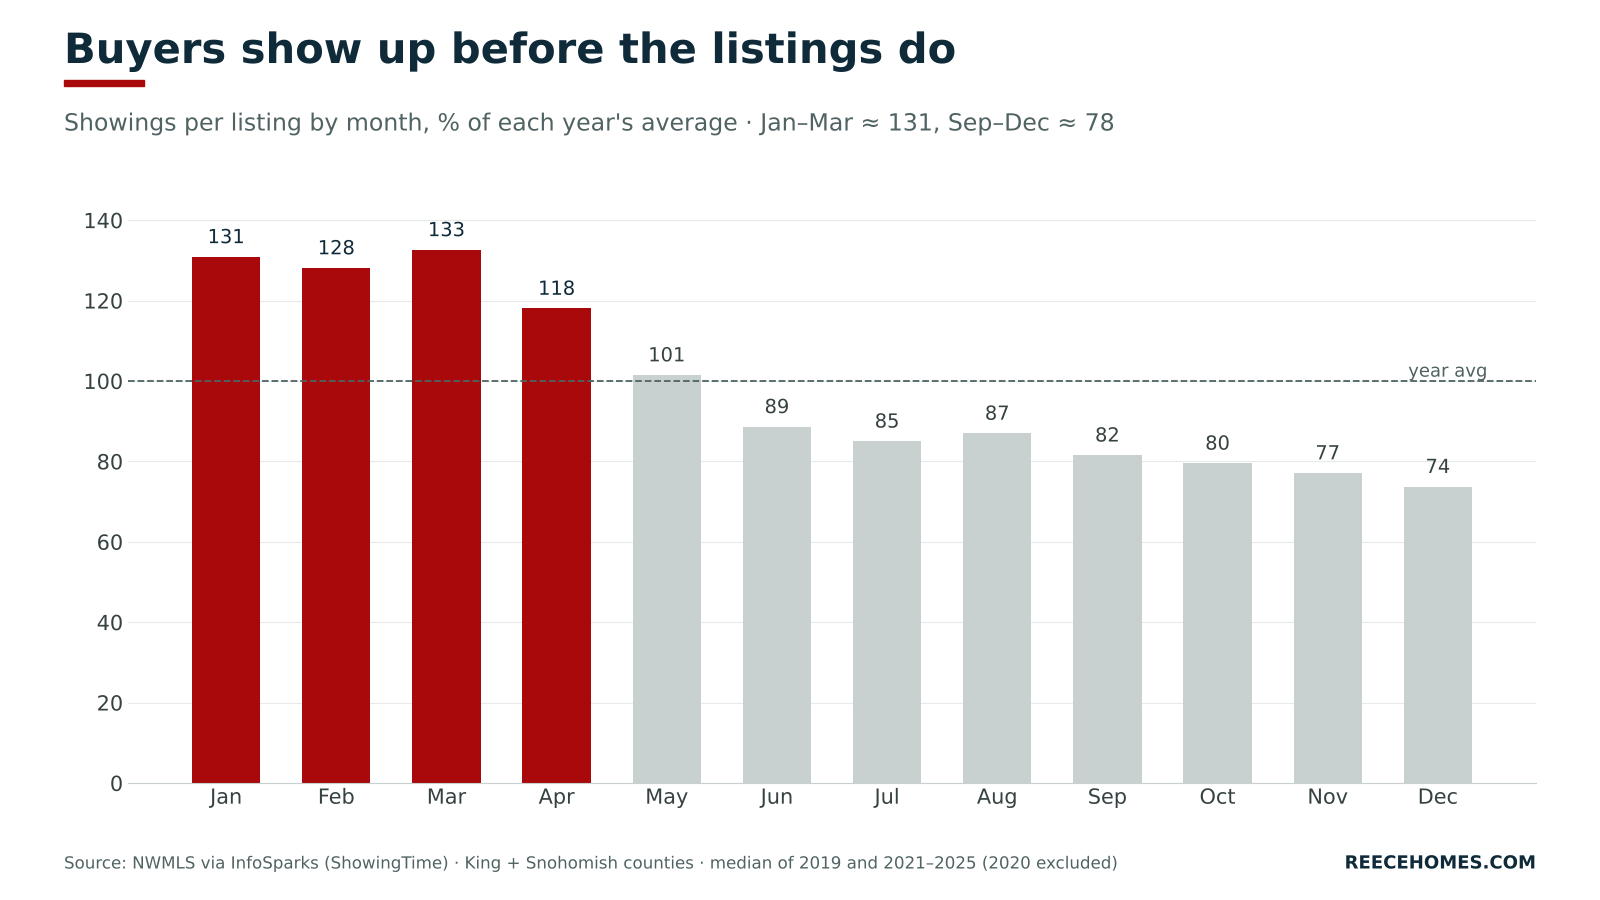
- Buyers book about 31% more showings per listing than average from January to March.
- Homes closing April through June beat their year's average sale-to-list ratio in 18 of 20 years.
1. Fewer competing listings early in the year
The number of homes for sale in King and Snohomish County is lowest in January and February. It climbs steadily all spring and summer and peaks in September, about 39% higher than in January.
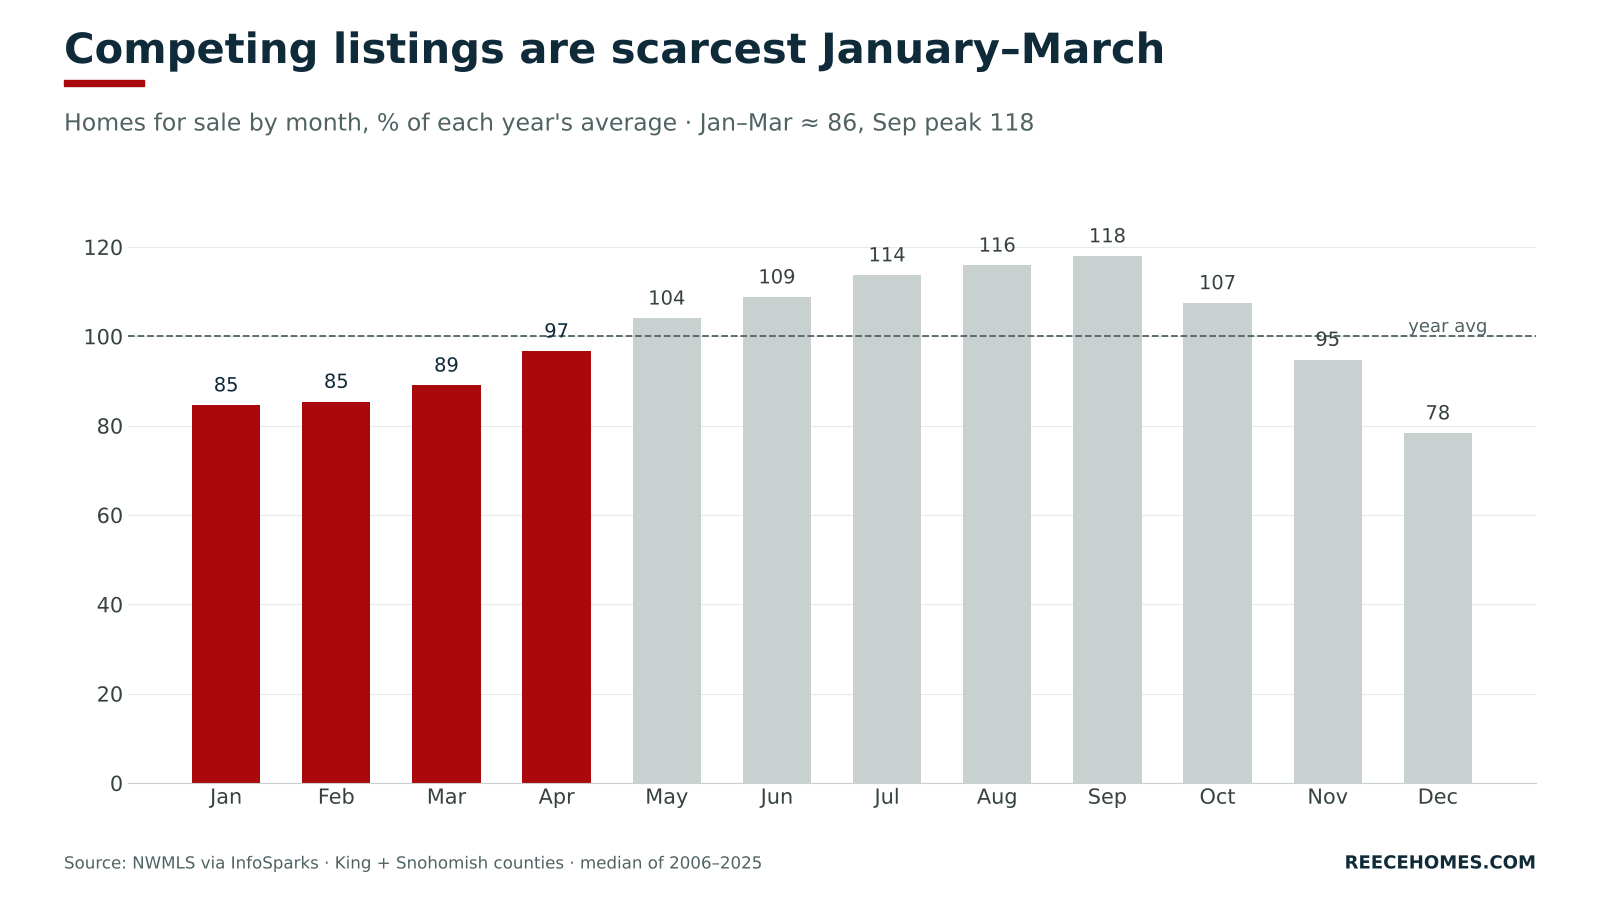
That matters because buyers compare. A listing that goes live in February competes with far fewer alternatives than the same home listed in August. Many sellers wait for warm weather and blooming yards, so by the time the market feels busy, it's also crowded.
Listing in late January, February or March puts your home in front of buyers before most of your competition arrives.
2. Buyers show up before sellers do
Buyers start their search right after the holidays, weeks before most sellers are ready. You can see it in showing activity: from January to March, buyers in King and Snohomish book about 31% more showings per listing than the yearly average. By fall, showings per listing fall to about 22% below average.
The balance shows up in absorption too — the share of homes for sale that go under contract in a month. From January to April, a median 45% of listings go pending each month. From September to December, it's 31%. That's roughly 48% more buyer pull on every listing in early spring.
Nationally, mortgage applications tell the same story. In the first week of January 2024, the Mortgage Bankers Association's purchase index jumped 40% (unadjusted) from Christmas week. Buyers get pre-approved in January and are ready to write offers by February.
What this means for you: a home that hits the market in late January to April meets a deep pool of motivated buyers and relatively few competing listings. That's the setup for multiple offers.
3. Spring contracts bring the strongest sale-to-list ratios
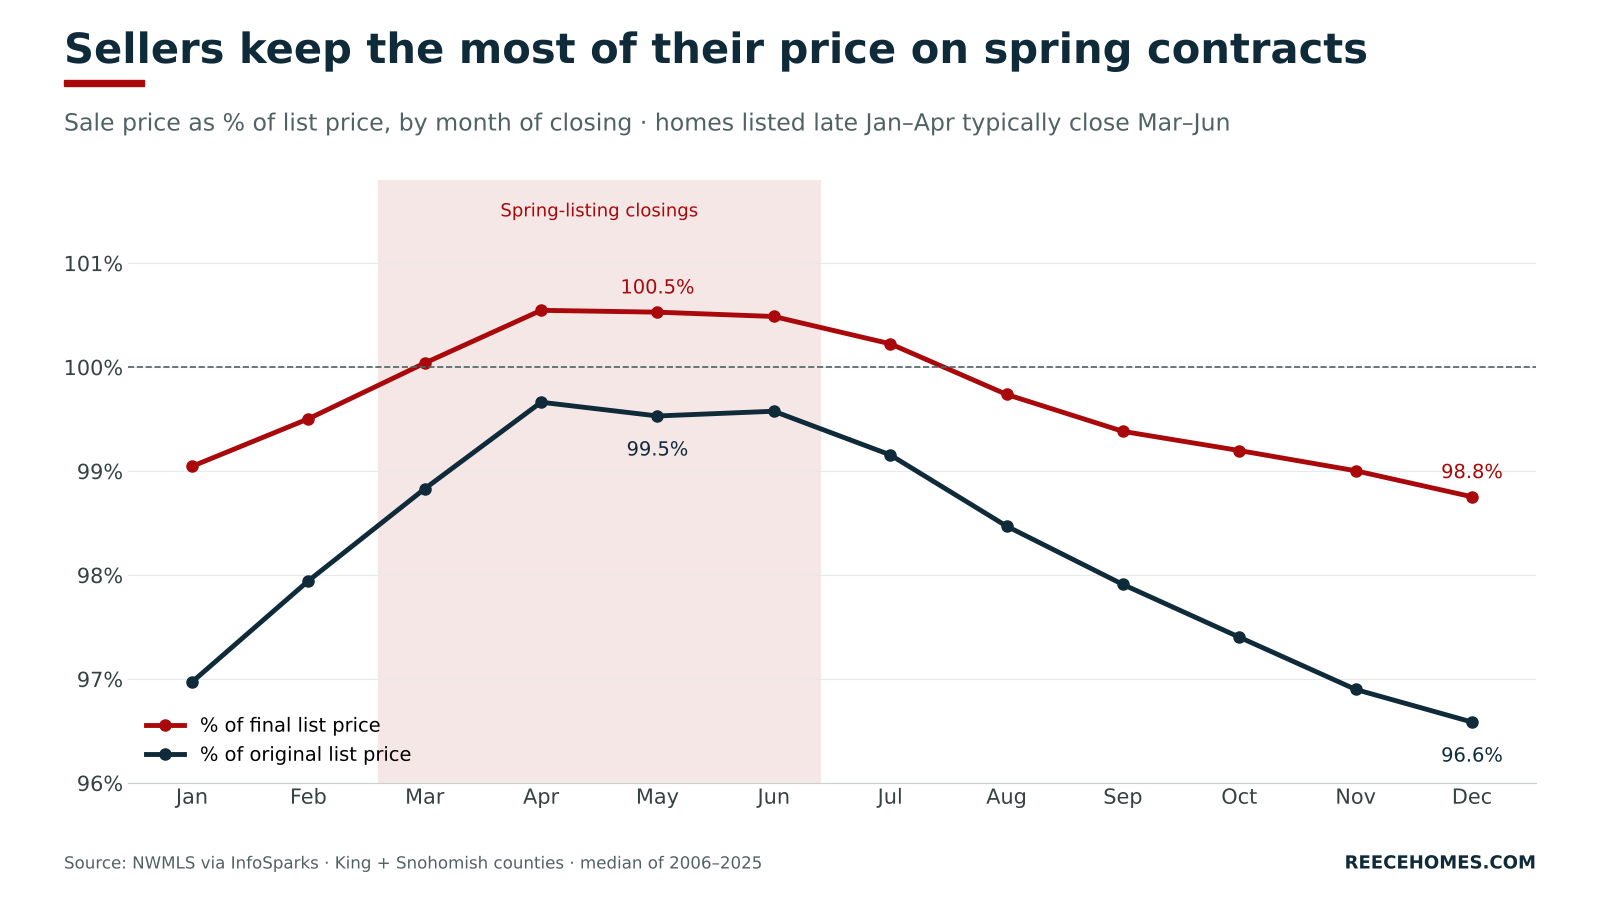
Sale-to-list ratio is the final sale price as a share of the asking price. NWMLS reports it by the month a sale closes. Most homes close 30–45 days after going under contract, so a home listed in late January to April usually closes between March and June.
Those closing months are the strongest of the year. Over 20 years, sales closing April through June beat their year's average sale-to-list ratio in 18 of 20 years. December closings did it in only 4.
| Quarter of closing | % of final list price | % of original list price |
|---|---|---|
| Q1 (Jan–Mar) | 100.0% | 97.9% |
| Q2 (Apr–Jun) | 101.0% | 99.4% |
| Q3 (Jul–Sep) | 99.8% | 98.0% |
| Q4 (Oct–Dec) | 99.1% | 96.8% |
Average of each year's quarterly figure, King + Snohomish, 2006–2025. Source: NWMLS.
The gap is widest against the original list price — before any price reductions. Spring sellers typically keep about 99.4% of their first asking price. Fall and winter sellers keep about 96.8%, because more of them reduce the price before an offer arrives.
Homes also sell faster in spring. Average days on market falls from about 49 days for February closings to about 27–29 days from May to July.
Breakout: selling later in the year doesn't mean selling for less
Spring may feel like the only time to sell, but home values don't typically fall later in the year. What changes in the fall is activity, not value.
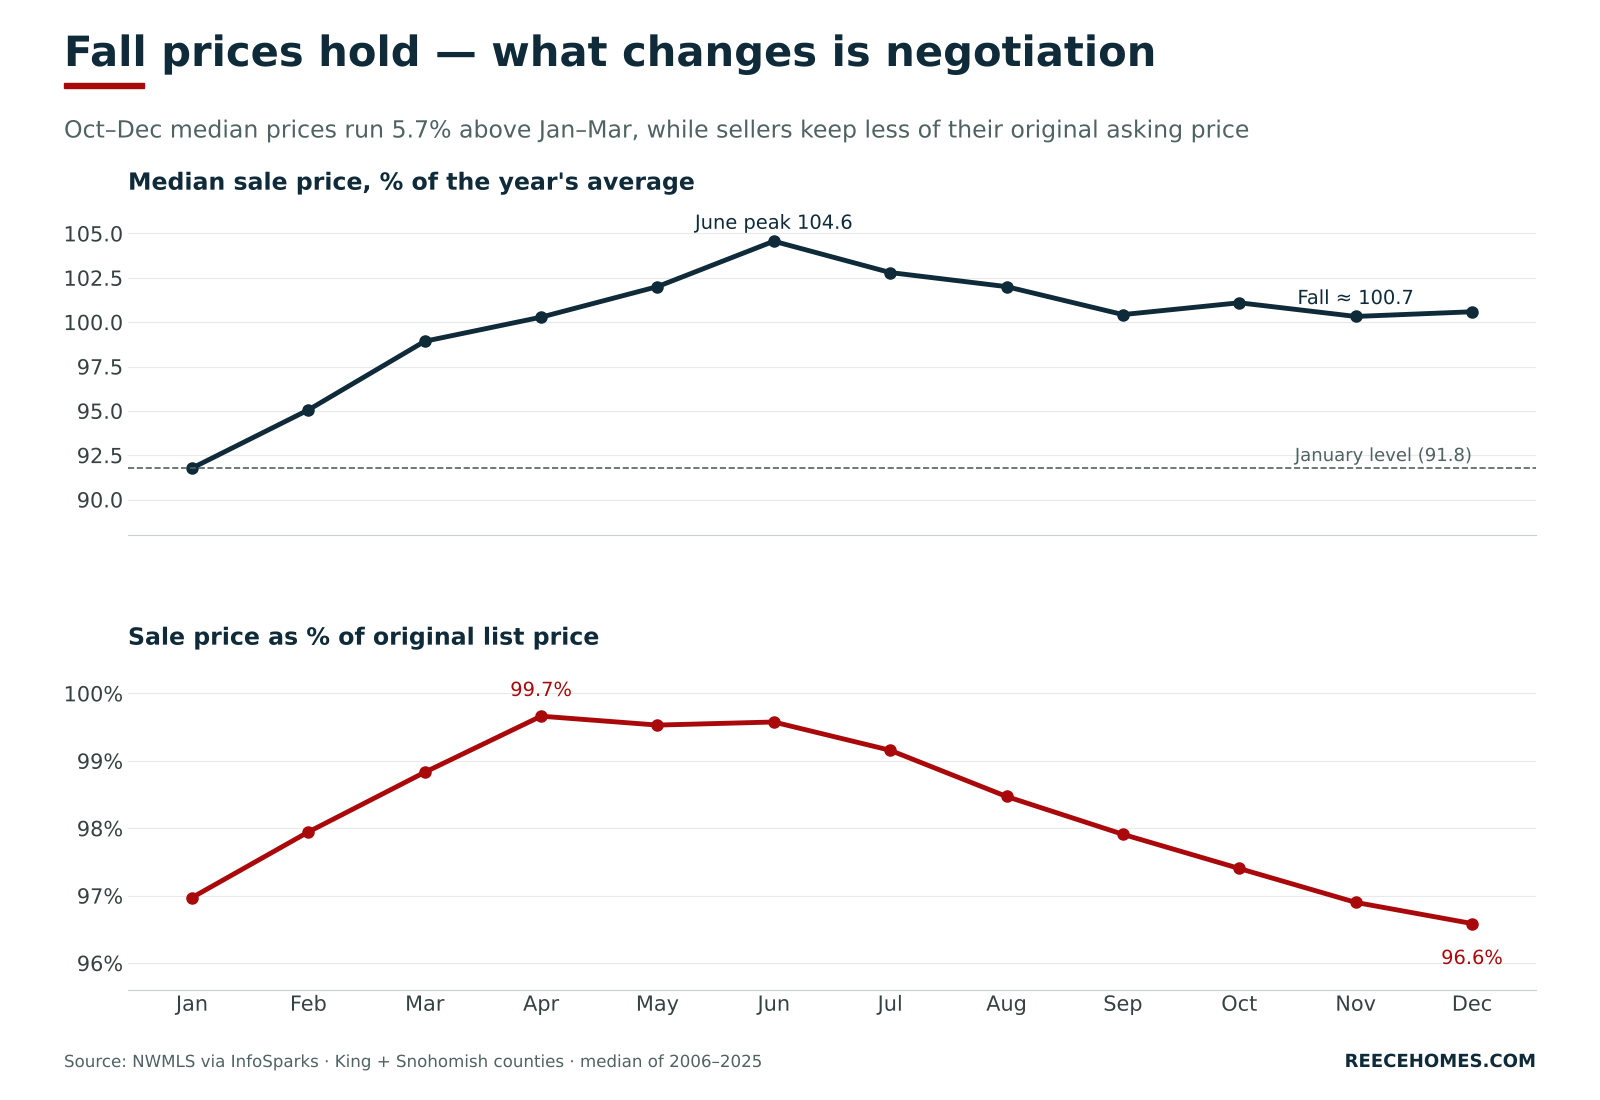
Median sale prices usually peak in June and ease slightly into fall. But they stay well above where the year began. In 14 of the last 20 years, the October–December median in King and Snohomish was higher than January–March of the same year — typically by about 5%. The exceptions were down-market years like 2007–2011 and 2022, when prices fell in every season.
What fall sellers give up is momentum. There are fewer showings per listing, homes take longer to sell, and more sellers reduce their price before an offer arrives. By December, sellers keep about 96.6% of their original asking price, versus about 99.7% in April.
The takeaway: if your life points to a fall or winter sale, you're not leaving your home's value on the table. Expect a slower pace and more negotiation, and price accurately from day one to avoid chasing the market down.
Price and days on market aren't the only things that matter
The calendar can give you an edge, but the right time to sell is the time that works for your life. A well-prepared home listed in June often does better than a rushed one listed in February. Before you circle a date, weigh these:
- Getting the home ready. Repairs, painting, decluttering and staging take time. Contractors book up in late winter, and some exterior work waits on dry weather. Plan backward from your target list date.
- Your family. A new baby, caring for a parent, a divorce or a loss can all reshape the timeline. The best move is one your household is ready to make.
- Your finances. Your next purchase, a rate lock, capital gains timing or simply having savings for the move can matter more than a fraction of a percent on price.
- School calendars. Many families want to move over summer break, which can make a June or July listing the right call — even if it isn't the statistical peak.
- Work. A job change, relocation date or new remote setup often sets the clock for you.
- Where you're going next. If you're buying too, the spring market works against you as a buyer as much as it works for you as a seller. Coordinating both sides matters.
The data tells you when the market tends to be strongest. A good plan uses that information to fit the market to your life — not the other way around.
Frequently asked questions
What is the best month to sell a house in the Seattle area?
March is the single strongest month for buyer demand in King and Snohomish County. Over 20 years, a median 55% of homes for sale went pending in March, the highest of any month. Listing between late January and April captures that window.
Is it bad to sell a house in the fall or winter?
No. Fall prices usually hold above where the year started. You'll typically see fewer showings, longer days on market and more price negotiation, but well-priced, well-prepared homes still sell year-round.
Do home prices drop in the winter in Washington?
Not meaningfully in most years. Median prices often ease slightly from the June peak, but in 14 of the last 20 years, October–December prices were higher than January–March of the same year.
When should I start preparing to list in spring?
Start in the fall or early winter. Repairs, painting, staging and photography can take several weeks, and contractors fill up quickly after the holidays.
Does the same pattern apply in Snohomish County and King County?
Yes. Both counties follow the same seasonal shape. Snohomish County's absorption peaks in March at about 57%, and King County's at about 53%.
Thinking about selling in 2027?
If you're considering a move in the new year, now is the time to plan. We'll walk through your home's value, a prep plan and a list date that fits both the market and your life. Contact Reece Homes for a no-pressure strategy session.
Sources and methodology
-
Northwest Multiple Listing Service via InfoSparks (ShowingTime): monthly new listings, homes for sale, pending and closed sales, median sale price, average days on market, percent of final and original list price, and showings per listing for King and Snohomish counties, January 2006–September 2026, all property types. Data pulled October 5, 2026.
-
Seasonal figures are medians across 20 full years (2006–2025). Each month is compared with its own year's average, so boom and bust years don't distort the pattern. The two counties are combined by summing counts and weighting ratios by closed sales.
-
Showings per listing uses 2019 and 2021–2025; 2020 is excluded because of the spring lockdown.
-
Mortgage applications: Mortgage Bankers Association weekly survey, reported by Mortgage News Daily (week ending January 5, 2024; national data).
-
Past seasonal patterns don't guarantee future results. Talk with a local broker about current conditions in your neighborhood.