Published August 13, 2026
August 2026 King & Snohomish County Housing Market Update

More Inventory, Higher Mortgage Rates, and a Market That Rewards Strategy
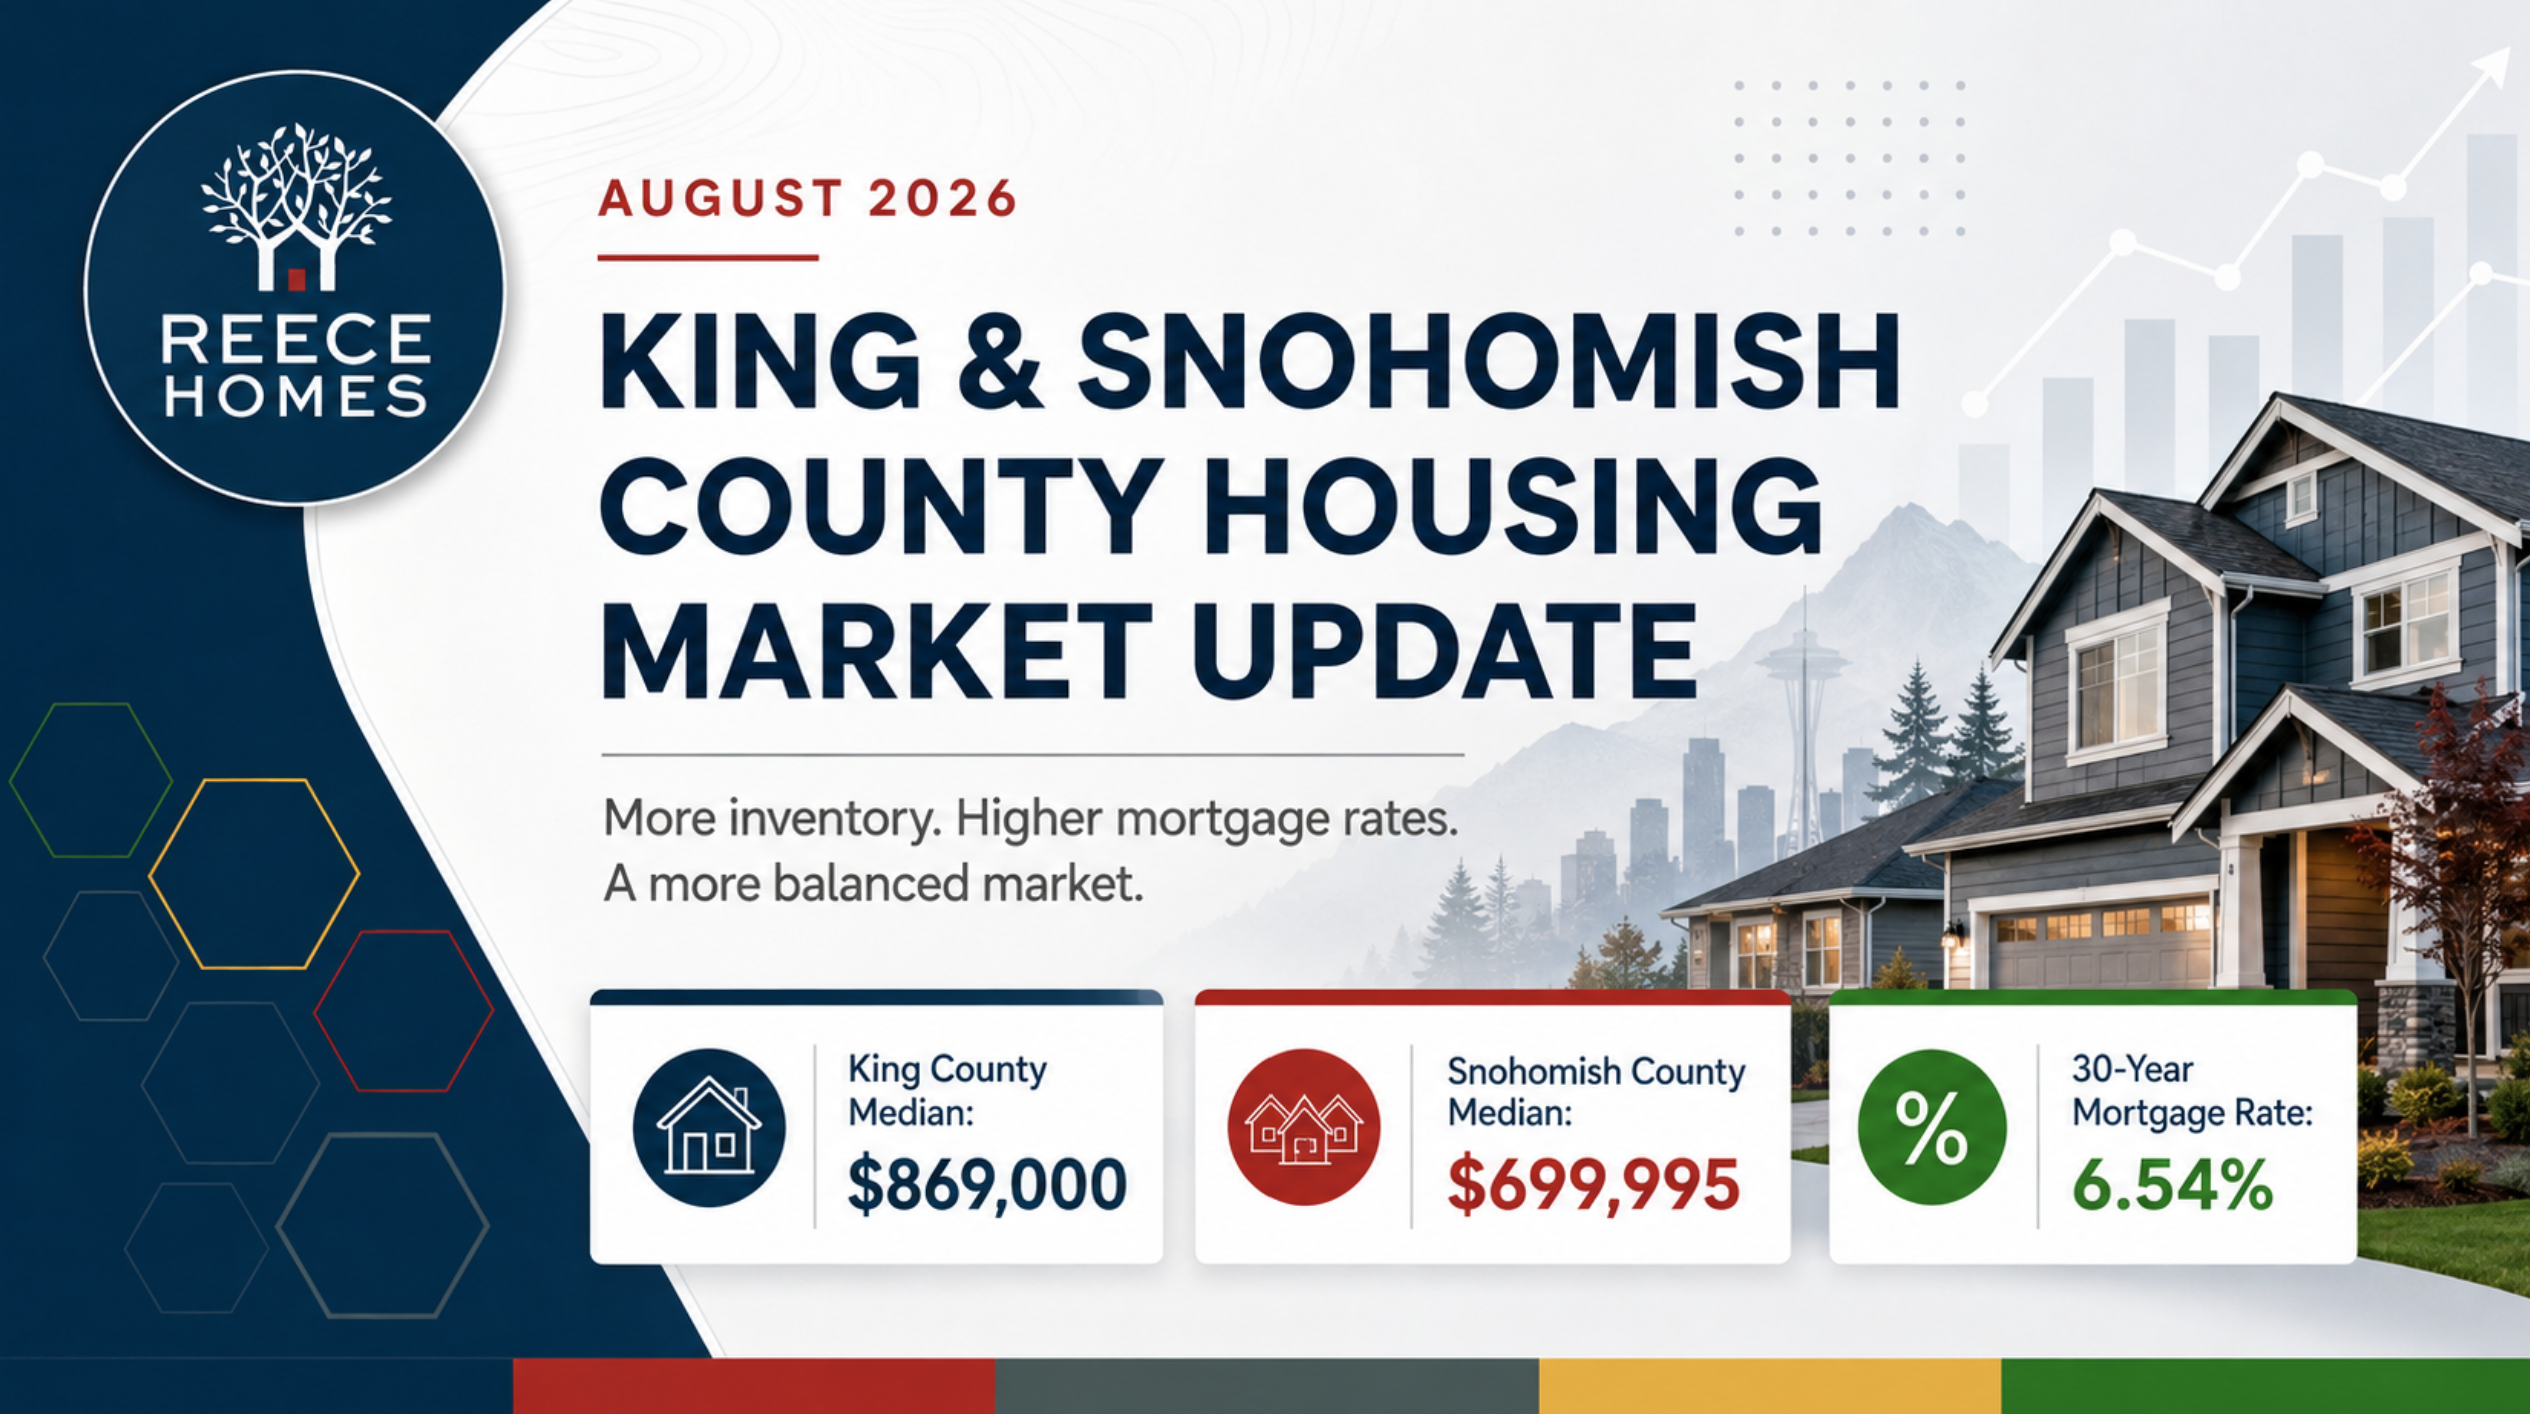
The August 2026 housing market update shows a continued shift toward a more balanced market across King and Snohomish counties.
Inventory is up sharply compared with last year. Homes are taking longer to sell. Buyers have more choices. Mortgage rates remain a major affordability constraint. And while prices remain historically strong, the market is more selective than it was during the low-inventory years.
This is a market where strategy matters.
For buyers, more inventory creates more opportunity.
For sellers, more inventory creates more competition.
For investors, more inventory creates more room to analyze.
The market is not behaving like 2021. It is not behaving exactly like 2022. And it is not simply returning to 2019.
Instead, we are seeing a new version of balance: higher inventory, higher borrowing costs, more buyer caution, and continued long-term support for well-positioned homes.
Quick Market Snapshot
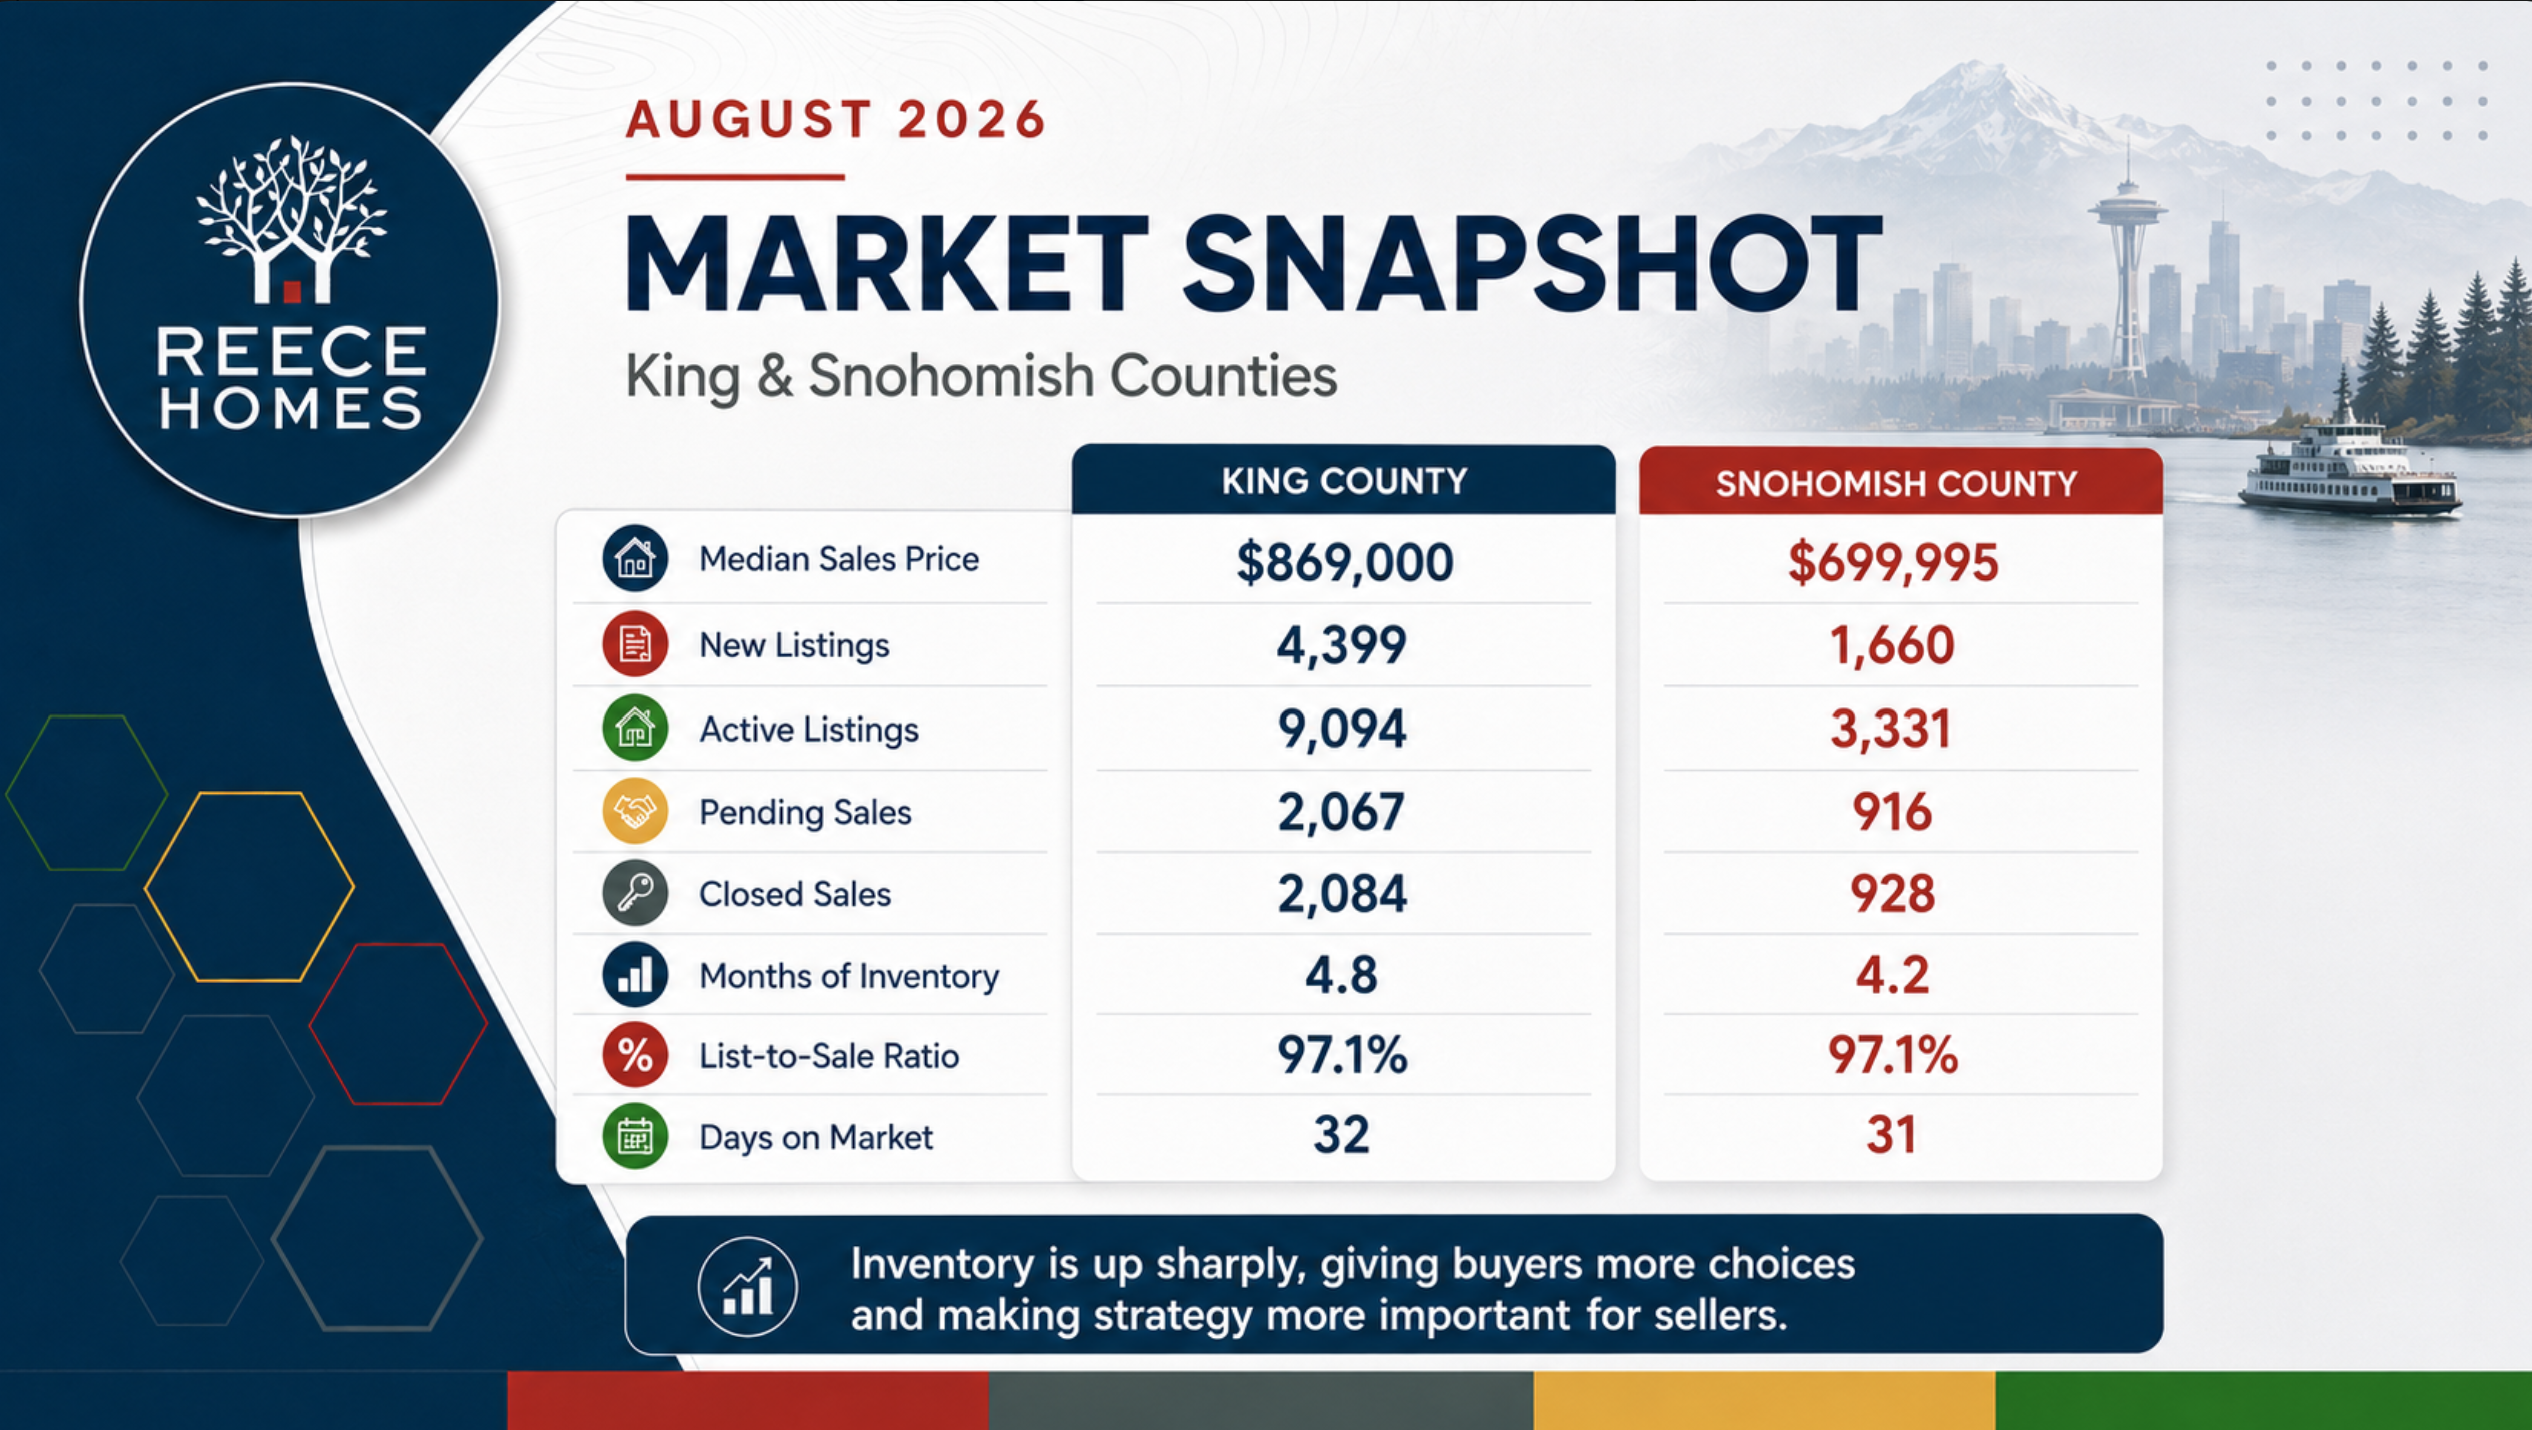
Based on July 2026 NWMLS data:
| Metric | King County | Snohomish County |
|---|---|---|
| Median Sales Price | $869,000 | $699,995 |
| New Listings | 4,399 | 1,660 |
| Active Listings | 9,094 | 3,331 |
| Pending Sales | 2,067 | 916 |
| Closed Sales | 2,084 | 928 |
| Months of Inventory | 4.8 | 4.2 |
| List-to-Sale Ratio | 97.1% | 97.1% |
| Days on Market | 32 | 31 |
The Big Story: Inventory Is No Longer Tight
The clearest trend in this month’s data is the continued rise in inventory.
Compared with last year:
- King County active listings are up 26.9%.
- Snohomish County active listings are up 39.0%.
- King County months of inventory is up 33.3%.
- Snohomish County months of inventory is up 44.8%.
That is a meaningful change.
Buyers have more homes to compare, more time to evaluate, and more ability to make thoughtful decisions. Sellers are no longer competing only against recent sales. They are competing against a much larger pool of active listings.
When buyers have more choices, they become more selective.
Historical Context: How Today Compares With 2021, 2022, and 2019
The best way to understand today’s market is to compare it with familiar reference points.
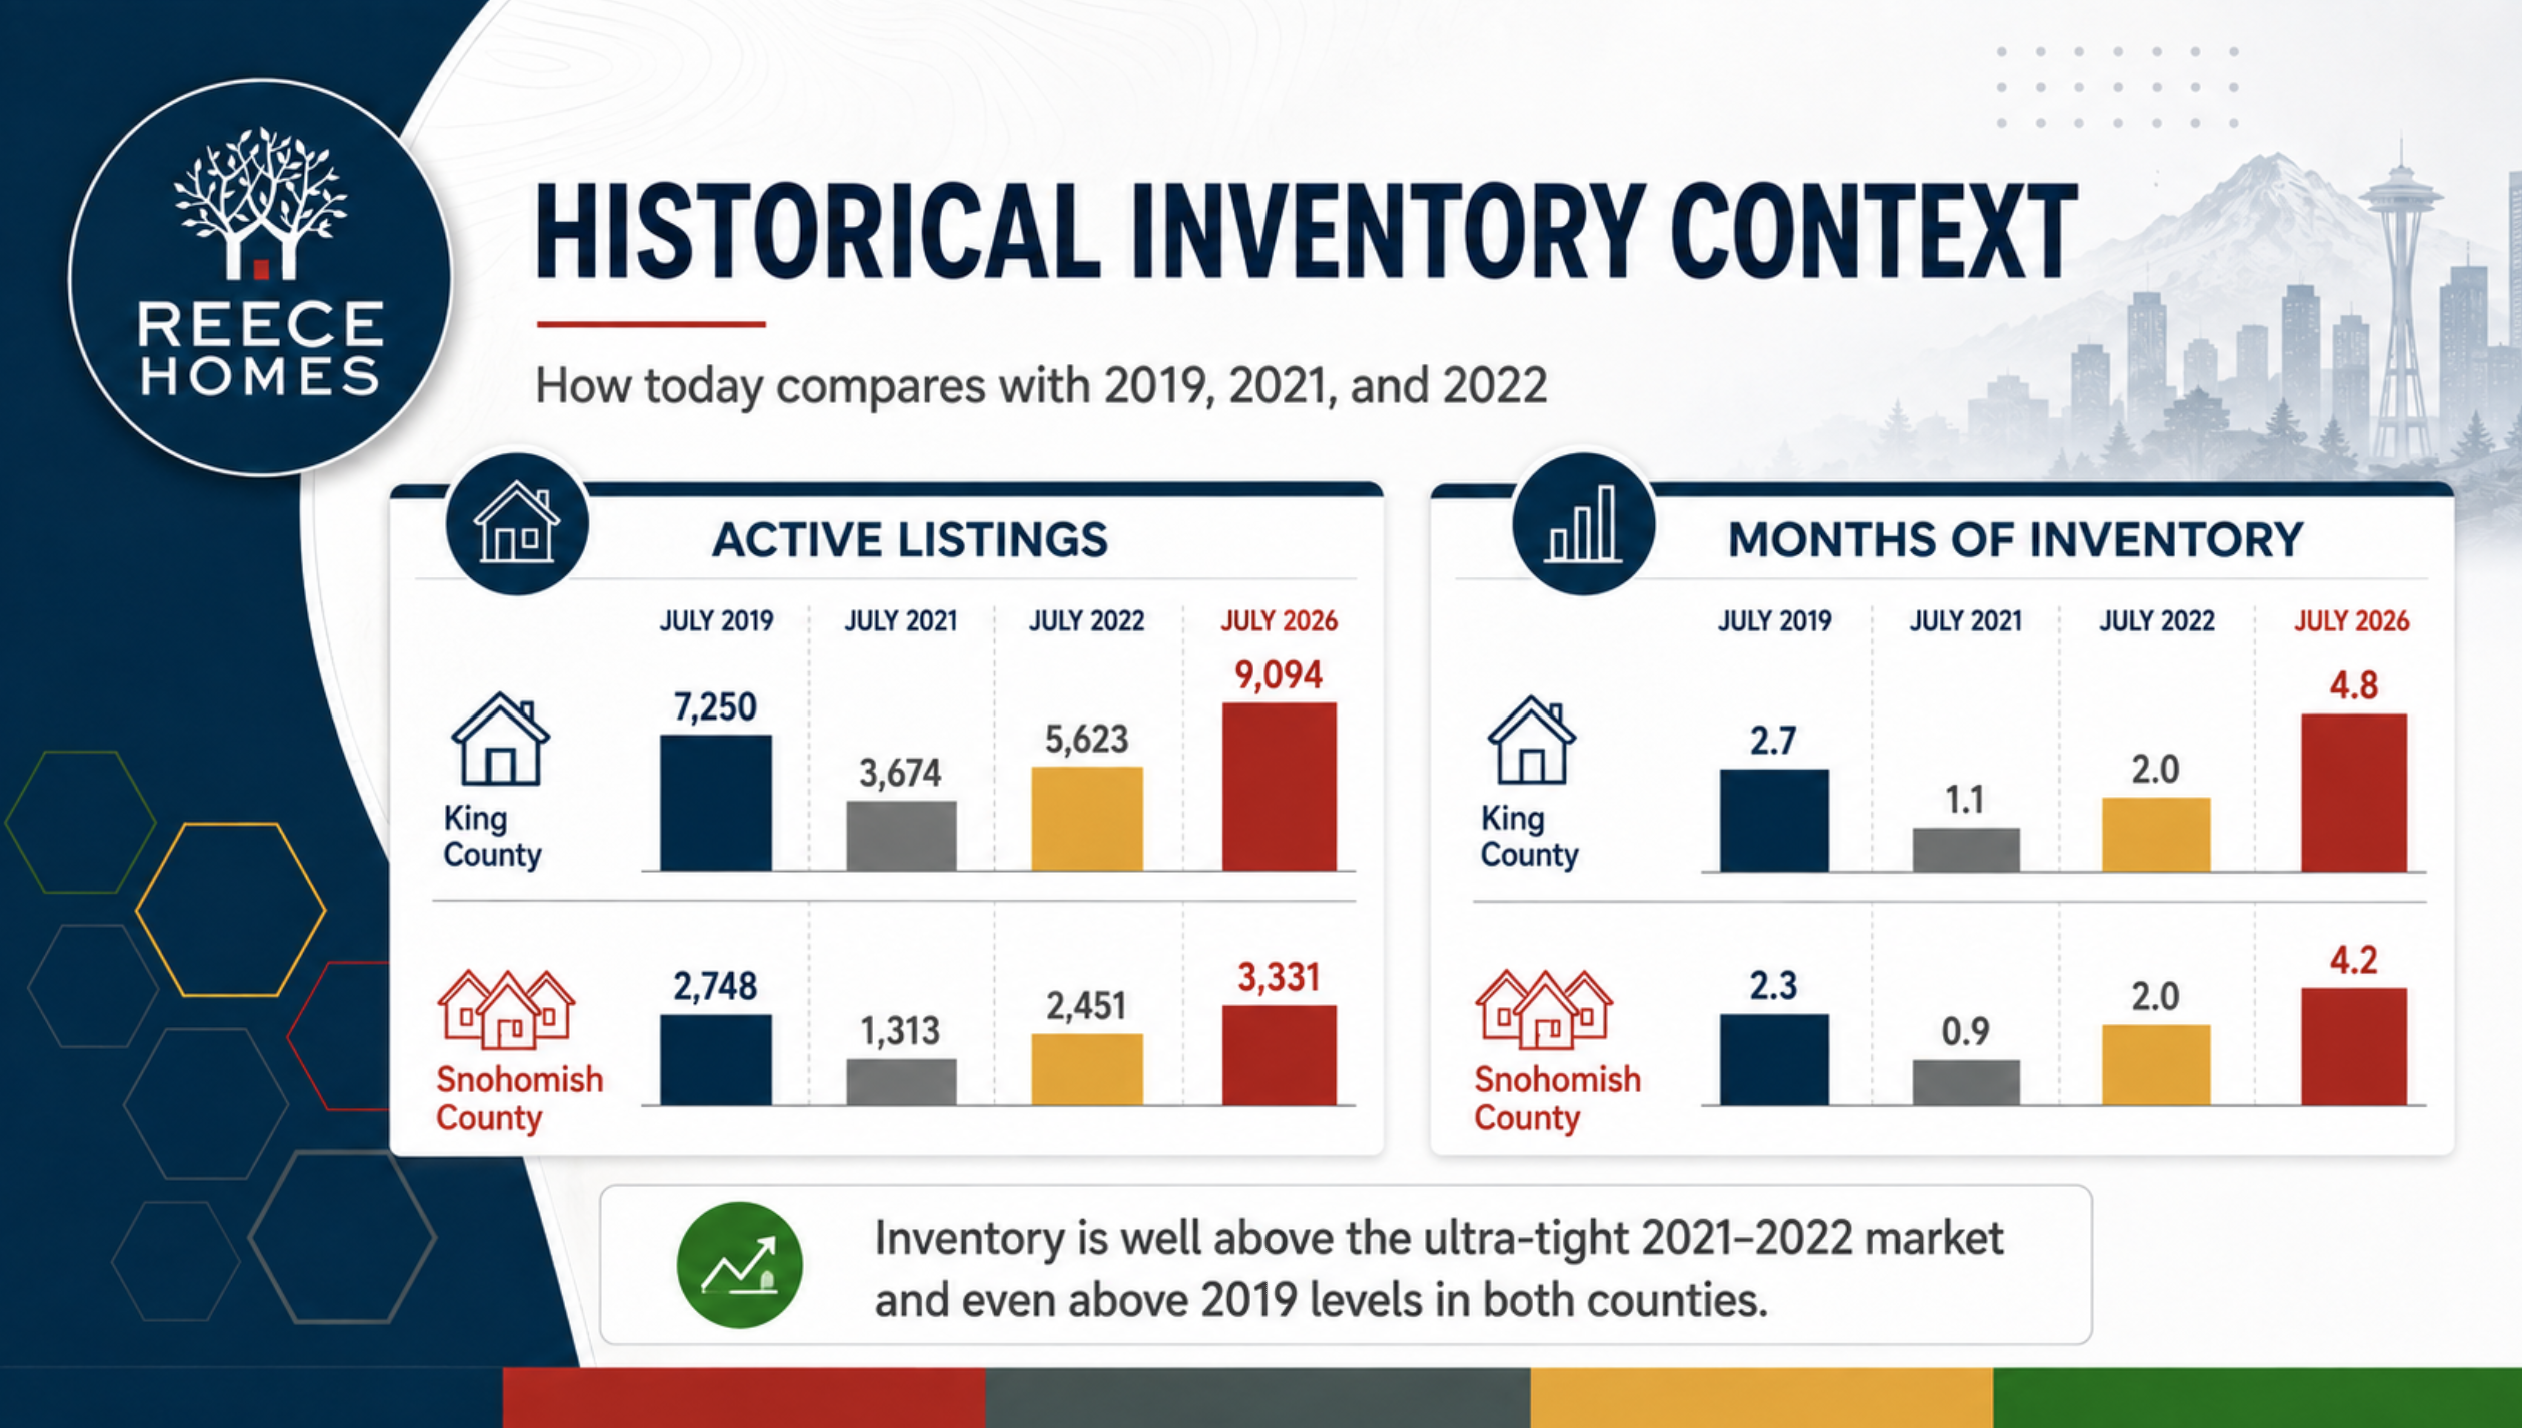
In July 2021, King County had 3,674 active listings. In July 2026, it had 9,094.
That means King County has nearly two and a half times as many active listings as it had during the 2021 low-inventory market.
Snohomish County shows a similar pattern. In July 2021, Snohomish County had 1,313 active listings. In July 2026, it had 3,331.
That is also more than two and a half times as much inventory.
Compared with July 2022, inventory is also significantly higher:
| County | July 2022 Active Listings | July 2026 Active Listings |
| King County | 5,623 | 9,094 |
| Snohomish County | 2,451 | 3,331 |
Even compared with July 2019, before the pandemic market reshaped buyer and seller expectations, inventory is higher:
| County | July 2019 Active Listings | July 2026 Active Listings |
| King County | 7,250 | 9,094 |
| Snohomish County | 2,748 | 3,331 |
That does not mean today’s market is weak.
It means buyers have options again.
The difference is especially clear when we look at months of inventory:
| Month | King County Months of Inventory | Snohomish County Months of Inventory |
| July 2021 | 1.1 | 0.9 |
| July 2022 | 2.0 | 2.0 |
| July 2019 | 2.7 | 2.3 |
| July 2026 | 4.8 | 4.2 |
This is the clearest sign that the market has moved away from the extreme seller’s market conditions of 2021 and 2022.
Buyers have more choices than they have had in years.
Sellers need to compete more carefully.
Prices Remain Historically Strong
Even with more inventory, prices remain historically strong.
King County’s median sales price was $869,000 in July 2026. That is up 2.2% from last year, up approximately 7% from July 2022, and up more than 40% from July 2019.
Snohomish County’s median sales price was $699,995. That is down 4.8% from last year and slightly below July 2022, but still nearly 50% higher than July 2019.
This is an important point.
The market has more inventory and more negotiating room, but that has not erased the price growth of the last several years.
For many homeowners, equity remains strong.
For many buyers, affordability remains challenging.
Those two truths can exist at the same time.
Mortgage Rates Are Reshaping Buyer Behavior
Mortgage rates remain one of the most important forces in the market.
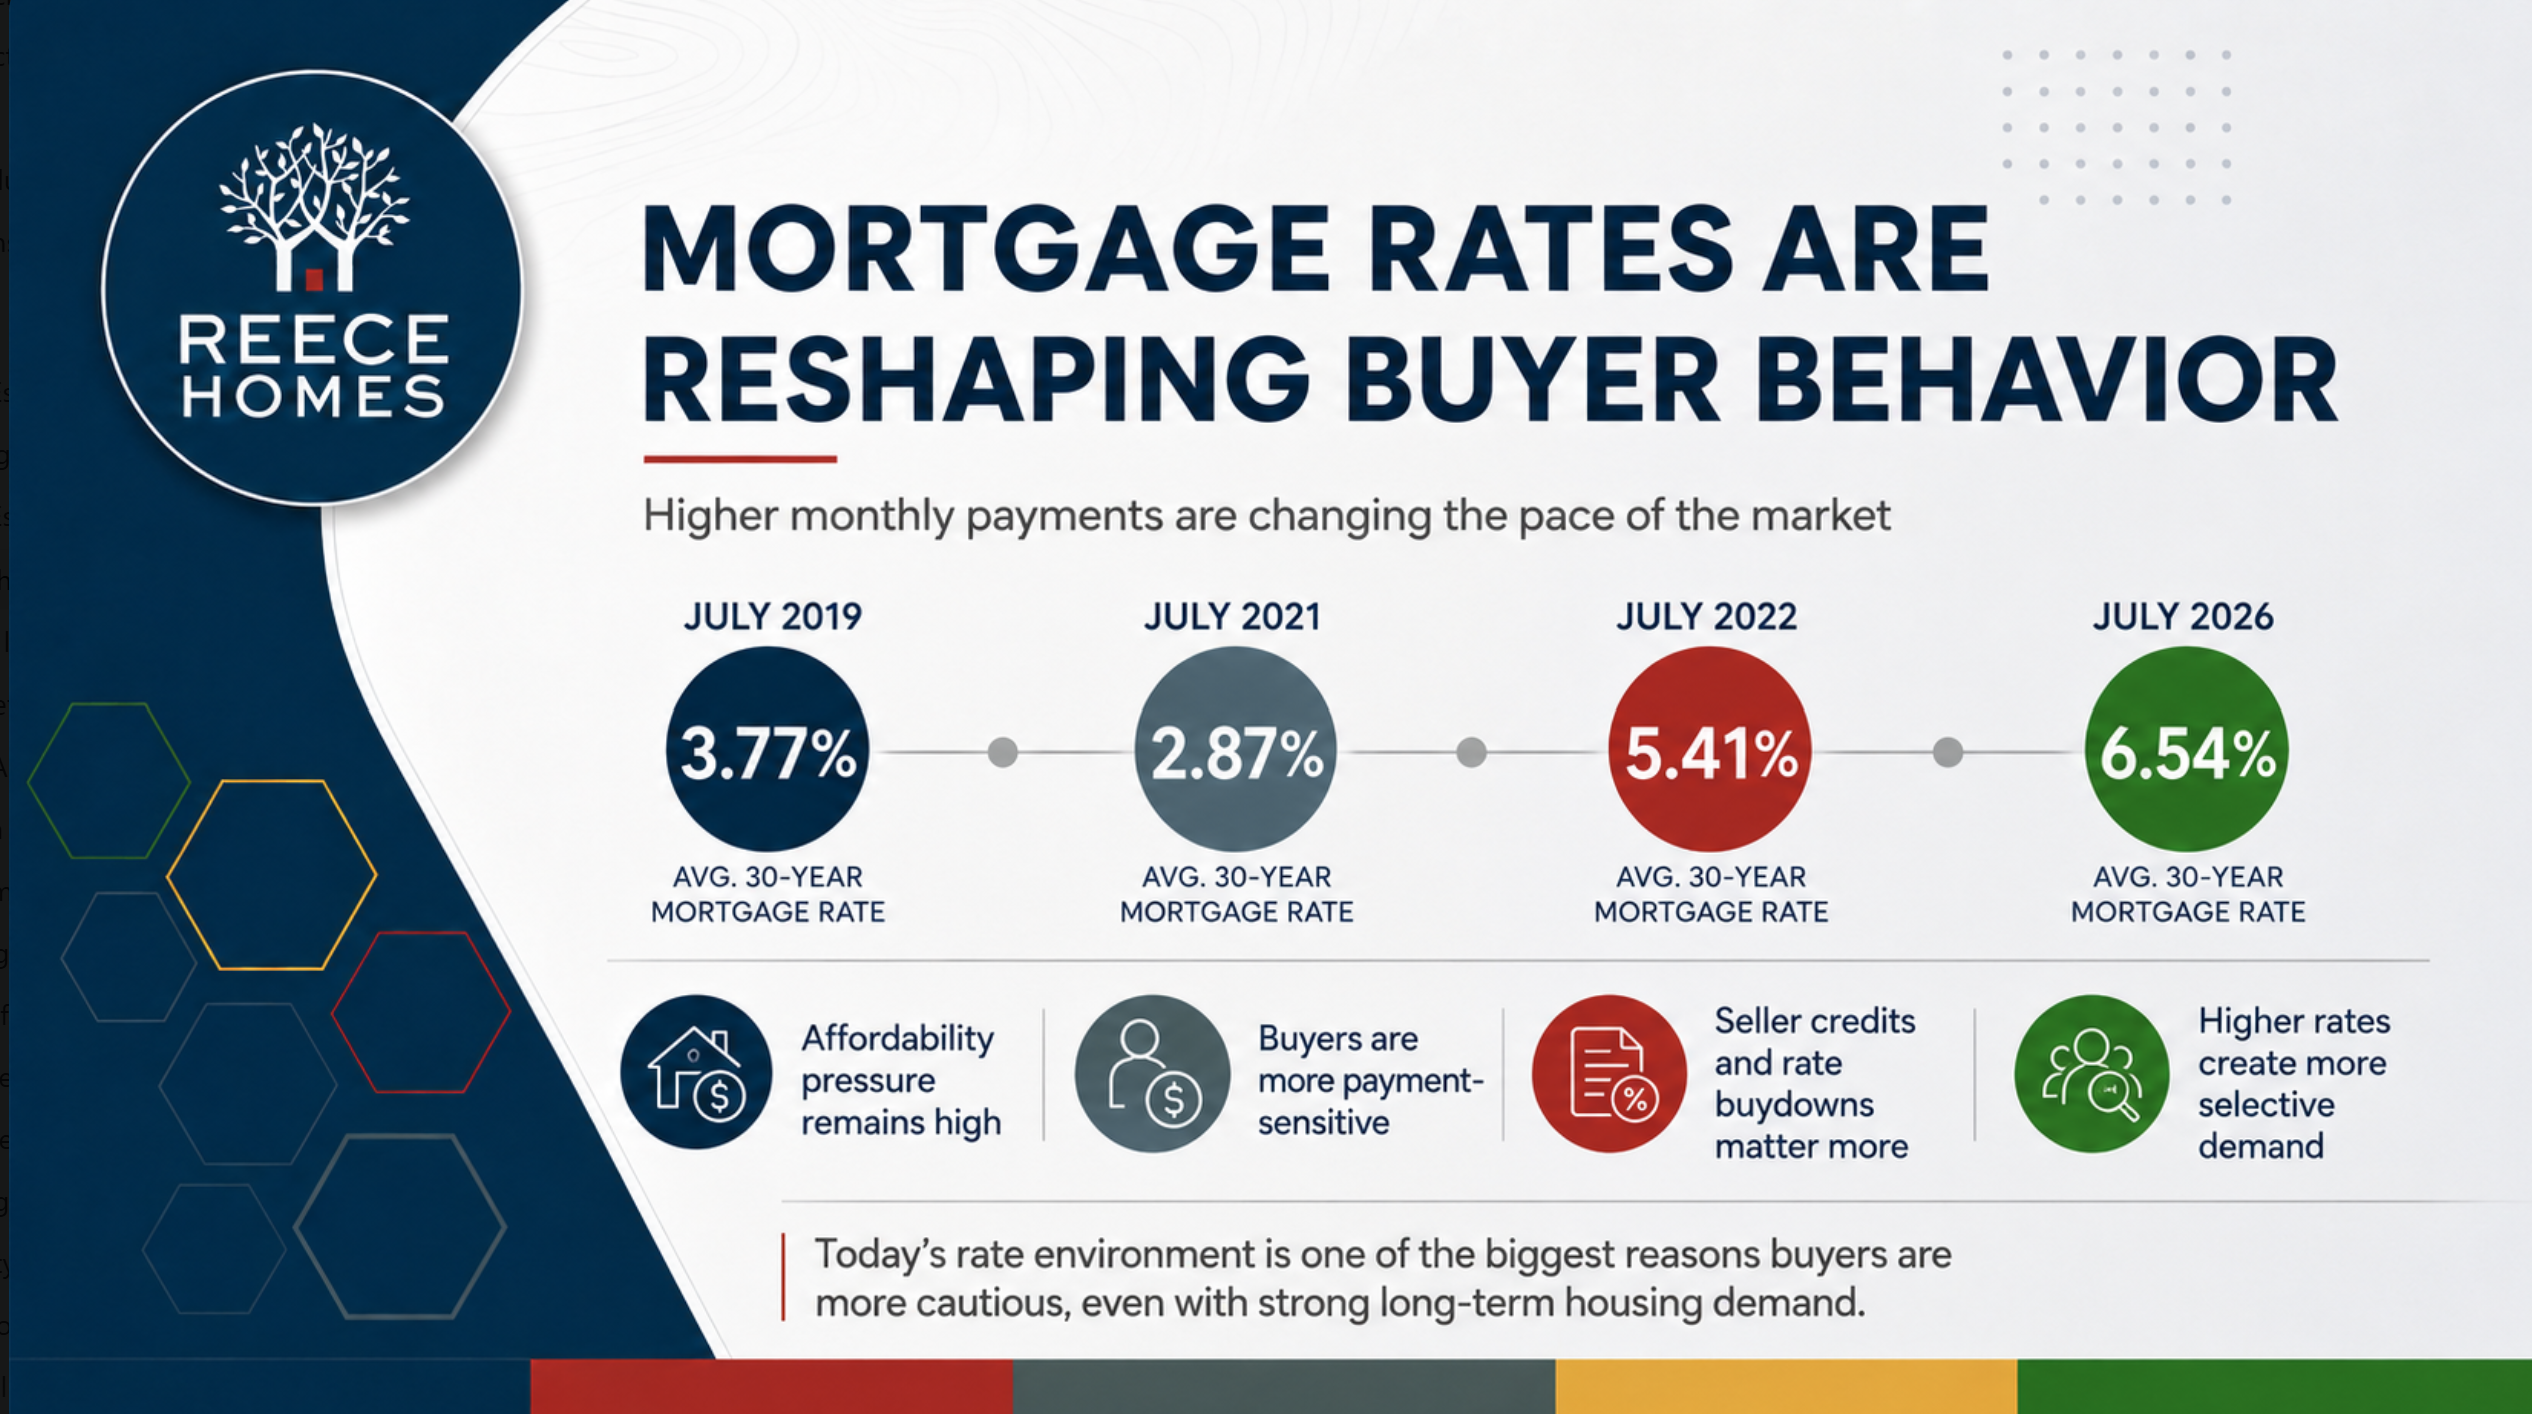
The average 30-year mortgage rate in July 2026 was approximately 6.54%.
That is only slightly lower than last year, but it is dramatically different from the market buyers experienced in 2021.
| Month | Average 30-Year Mortgage Rate |
| July 2021 | 2.87% |
| July 2019 | 3.77% |
| July 2022 | 5.41% |
| July 2026 | 6.54% |
That shift changes everything.
A buyer shopping at today’s rates is not just looking at the purchase price. They are focused on the monthly payment.
Higher mortgage rates affect:
- Affordability
- Price sensitivity
- Buyer confidence
- Offer strategy
- Inspection decisions
- Requests for seller credits
- Interest in rate buydowns
- Willingness to stretch for a home
This is why the market can have historically strong prices and still feel much more cautious.
A $869,000 King County home at 6.54% creates a very different monthly payment than a similarly priced home would have created at 2.87%.
That payment shock is one of the main reasons buyers are more selective.
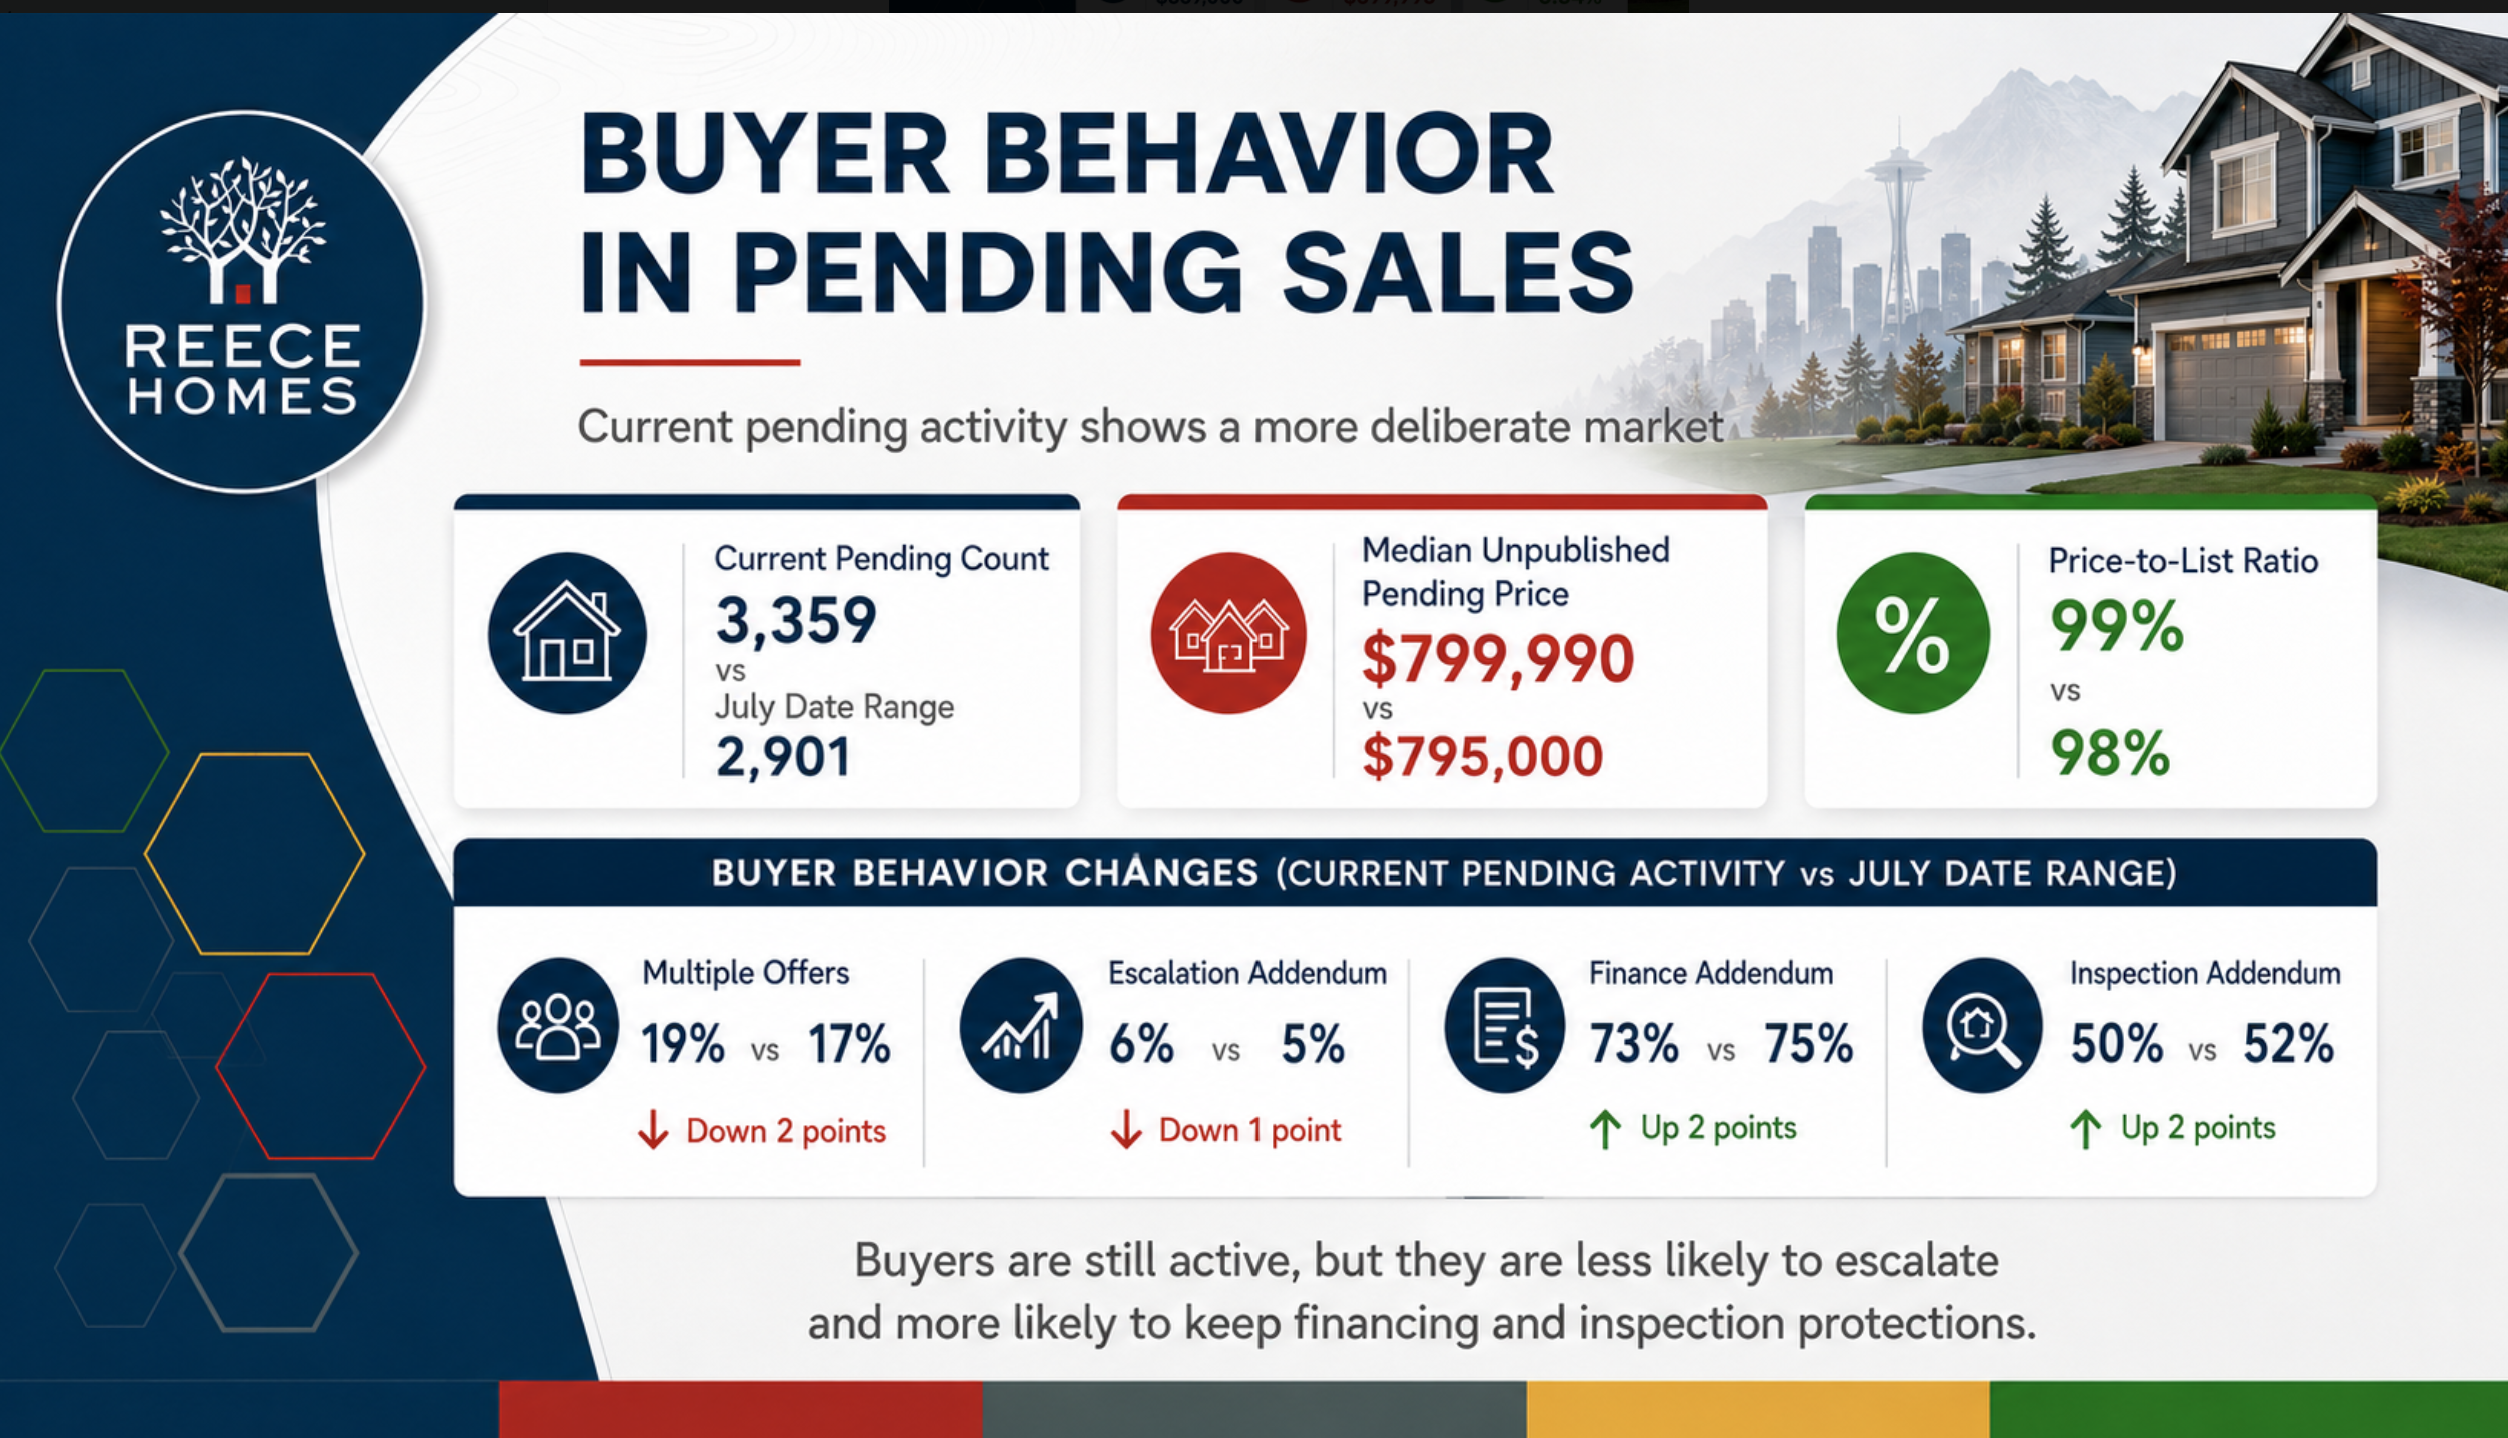
Buyer Behavior: Pending Sales Confirm the Shift
The latest NWMLS Pending Listing Report gives us a useful look at what buyers are doing right now.
The report was generated on August 13, 2026 and compares current pending listings with pending activity from July 1–31, 2026 for residential and condo properties in King and Snohomish counties.
The report shows a current pending count of 3,359 compared with 2,901 in the July date range.
The median unpublished pending price was $799,990, compared with $795,000 for the July date range, a modest 0.6% increase.
The average unpublished pending price-to-list-price ratio was 99%, compared with 98% for the July date range.
That tells us buyers are still writing offers close to asking price when they decide to move forward.
But the rest of the report shows a more cautious buyer environment:
| Pending Sale Behavior | July Date Range | Current Pending | Change |
| Multiple Offers | 19% | 17% | Down 2 points |
| Escalation Addendum | 6% | 5% | Down 1 point |
| Finance Addendum | 73% | 75% | Up 2 points |
| Inspection Addendum | 50% | 52% | Up 2 points |
This is one of the most useful parts of the market story.
Buyers are still active. They are still making offers. Strong homes can still attract interest.
But buyers are less likely to escalate aggressively and more likely to keep financing and inspection protections in place.
That is a healthier and more deliberate market.
Pending Sales Show Buyer Caution
Pending sales in the monthly NWMLS summary were lower month over month in both counties.
- King County pending sales were down 3.9% from the previous month.
- Snohomish County pending sales were down 4.7% from the previous month.
Compared with last year, pending sales were down 5.2% in King County but up 1.8% in Snohomish County.
This suggests buyers are still present, but selective.
They are comparing more homes. They are watching rates. They are calculating monthly payments. They are paying attention to days on market. And they are more likely to ask for protections, credits, or repairs than they were during the most competitive years.
In today’s market, buyers are not just asking, “Do I like this home?”
They are asking:
- Is the price justified?
- What else is available?
- How long has it been on the market?
- Can we negotiate?
- What will the monthly payment feel like?
- Are there inspection or repair concerns?
- Is this the right home, or just the best of what we have seen so far?
That mindset changes how sellers need to prepare and position their homes.
Closed Sales Slowed
Closed sales were lower than last year in both counties.
- King County closed sales were down 11.9% year over year.
- Snohomish County closed sales were down 2.9% year over year.
This is one of the clearest signs that the market is not as fast or automatic as it was during the ultra-low inventory years.
More inventory does not automatically mean more sales.
It means buyers have more choices.
And when buyers have more choices, homes need to compete more effectively.
Homes Are Taking Longer To Sell
Market time continues to increase.
- King County homes averaged 32 days on market.
- Snohomish County homes averaged 31 days on market.
That is much slower than the 2021 and 2022 market.
In July 2021, King County homes averaged 13 days on market and Snohomish County homes averaged 12. In July 2022, King County was at 14 days and Snohomish County was at 15.
Today’s market time is also slightly longer than July 2019, when King County averaged 28 days and Snohomish County averaged 25.
That does not mean homes are not selling.
It means the pace has changed.
Buyers are taking more time. Sellers are facing more competition. And the first few weeks on market are increasingly important.
A home that launches too high may miss its best window of buyer attention.
A home that launches well prepared, well priced, and well marketed can still stand out.
List-to-Sale Ratios Are Softer Than the Pandemic Market
Both King and Snohomish counties posted a 97.1% list-to-sale ratio in July 2026.
That is very different from July 2021, when both counties were above 105%.
This is another sign that the market has normalized.
Buyers are no longer broadly bidding above list price across the market the way they were during the most competitive period. Instead, they are more likely to evaluate the home, the price, the competition, the rate environment, and the condition before deciding how aggressively to offer.
For sellers, this is a reminder that pricing should be strategic from the start.
For buyers, it shows there may be room to negotiate, especially on homes that have been sitting, need work, or were priced too aggressively.
Economic Context
The latest economic data continues to show a mixed backdrop.
Mortgage rates remain elevated, averaging about 6.54% in July. U.S. unemployment was 4.1% in July, while the latest local data showed Seattle-area unemployment at 5.2% and Washington unemployment also at 5.2% in June.
Seattle-area inflation, based on the latest local CPI reading, was approximately 4.5% year over year in June.
That matters because buyers are not only dealing with mortgage rates. They are also dealing with the broader cost of living.
Housing affordability is still under pressure.
At the same time, the Puget Sound region continues to benefit from high household incomes, long-term employment strength, and limited housing supply in many desirable neighborhoods.
That combination helps explain why prices remain historically strong even as inventory rises.
What This Means for Sellers
Sellers still have opportunity, but the market is less forgiving.
The homes that perform best are typically the ones that are:
- Priced accurately from day one
- Prepared before going live
- Easy for buyers to understand
- Professionally photographed and marketed
- Positioned clearly against competing listings
- Responsive to buyer feedback
The biggest mistake sellers can make right now is assuming that last year’s strategy will work in this year’s market.
More inventory means buyers have alternatives.
If a home is overpriced, poorly presented, difficult to access, or unclear in its value, buyers may simply move on.
What This Means for Buyers
Buyers have more leverage than they have had in several years.
More inventory can create:
- More homes to choose from
- Less pressure to rush
- Better ability to keep important protections
- More room to negotiate price, repairs, credits, or terms
- Better odds of finding a home that fits both lifestyle and budget
That does not mean every home is easy to buy.
The best homes can still sell quickly and attract strong interest.
But overall, buyers have more room to be thoughtful and strategic than they did during the low-inventory market.
What This Means for Investors
For investors, rising inventory can create more opportunities, but higher rates continue to make the numbers more challenging.
The best opportunities may come from properties where the average buyer sees friction, such as:
- Cosmetic updates
- Longer days on market
- ADU or DADU potential
- Strong rental locations
- Properties that were overpriced initially
- Sellers who value certainty and clean terms
This is not a market where every deal works.
But it is a market where disciplined investors may find opportunities that were harder to find when inventory was extremely low.
What We’re Watching Next
Over the next few months, we will be watching:
- Whether inventory continues rising into fall
- Whether mortgage rates remain in the mid-6% range
- Whether pending sales stabilize
- Whether sellers adjust pricing expectations
- Whether days on market continue increasing
- Whether buyer protections remain more common
- Whether Snohomish County continues showing more affordability pressure than King County
The fall market will be important.
If inventory remains elevated and buyer activity slows further, sellers may need to become more flexible. If rates improve or buyers gain confidence, some of the current inventory could create opportunity for renewed activity.
Bottom Line
The August 2026 market update shows a more balanced housing market across King and Snohomish counties.
Inventory is rising. Buyers have more choices. Mortgage rates remain the biggest affordability challenge. Homes are taking longer to sell. And sellers need stronger pricing and preparation strategies.
At the same time, prices remain historically strong, and well-positioned homes are still selling.
This is a market that rewards thoughtful planning.
If you are thinking about buying, selling, investing, downsizing, or simply want to understand what your home may be worth in today’s market, Reece Homes would be happy to help you evaluate your options.